- Everyone wants to bag a huge run during alt season
- It can be tempting to jump into a pumping coin, but this is when you should be selling, not buying
- Our guide will show you how to find and trade an alt in alt season
Bagging a big return is exactly what alt season is all about, but how do you spot the alts that are about to run rather than jumping in when they’ve pumped? The answer is easier than you think, which our guide will demonstrate.
Step 1
Find an alt that has bottomed out on its BTC (or USDT if it hasn’t pumped in USDT terms yet) pairing following a parabolic run in 2018 and subsequent collapse. One example is IOTA:
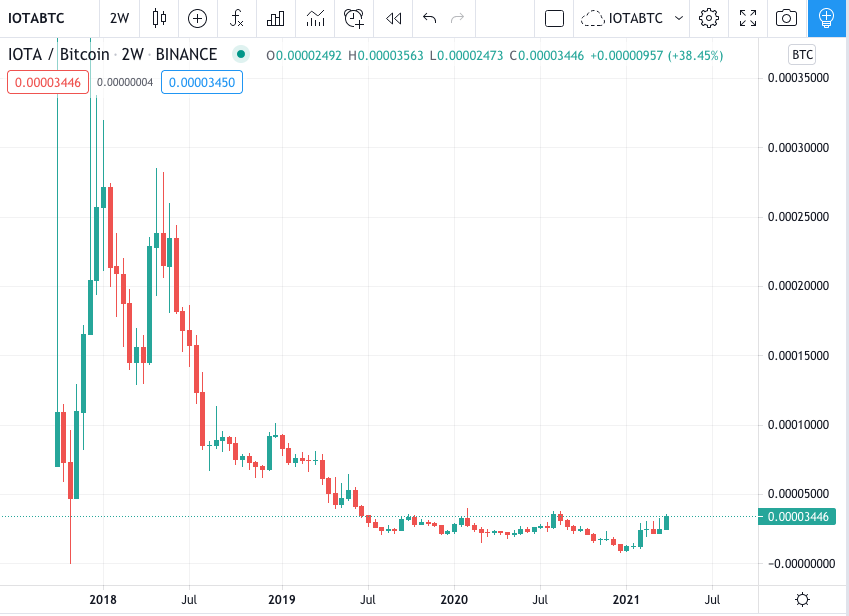
At this stage, fundamentals almost don’t matter, although good fundamentals will help. All we’re looking for is a long accumulation period followed by a series of higher highs and higher lows off the bottom, which we have with this IOTA chart. This shows that IOTA is clearly ready for a move up.
Step 2
Next we need to wait for our coin to show some strength so we can be sure a run is imminent. In the case of IOTA, we can see that it is currently tackling a price at which it has rejected multiple times since October 2019. What’s different this time round is that it is doing it with much bigger buy volume:
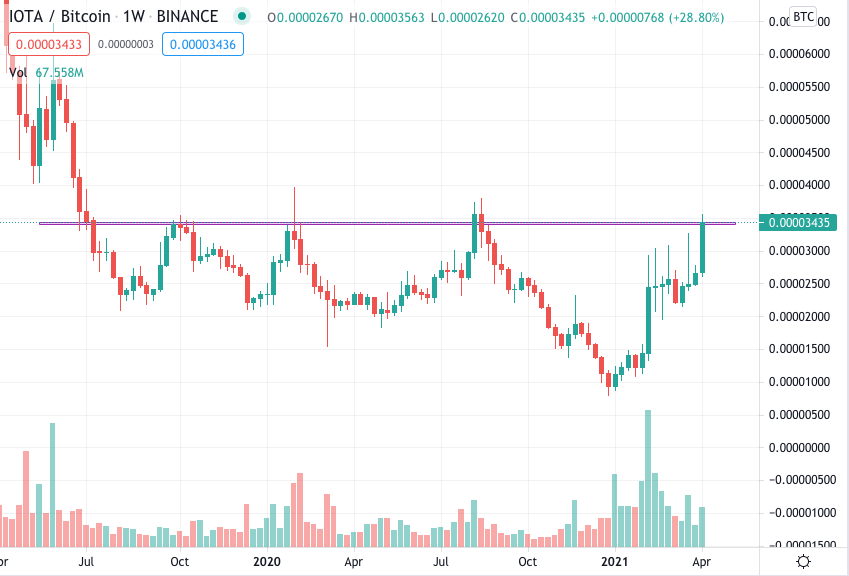
For confirmation we’re looking for IOTA to cross that resistance and close above it on the daily timeframe. Ideally it will drop back to the line again but remain above it. This is known as a support/resistance flip and is incredibly bullish, especially when combined with high volume. This is what IOTA was doing yesterday:
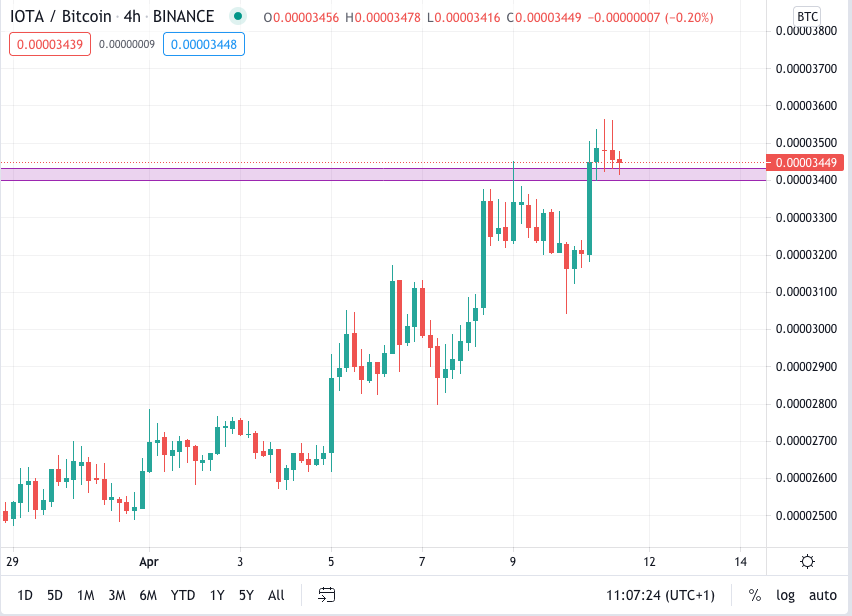
Once this support/resistance slip is achieved, we can start looking at targets further up.
Step 3
Finding your targets is easy when an alt has retraced. What we’re looking for are clear areas on the chart where strong support and resistance was shown during the previous rally and collapse. These will often act as stopping points along the way back up:
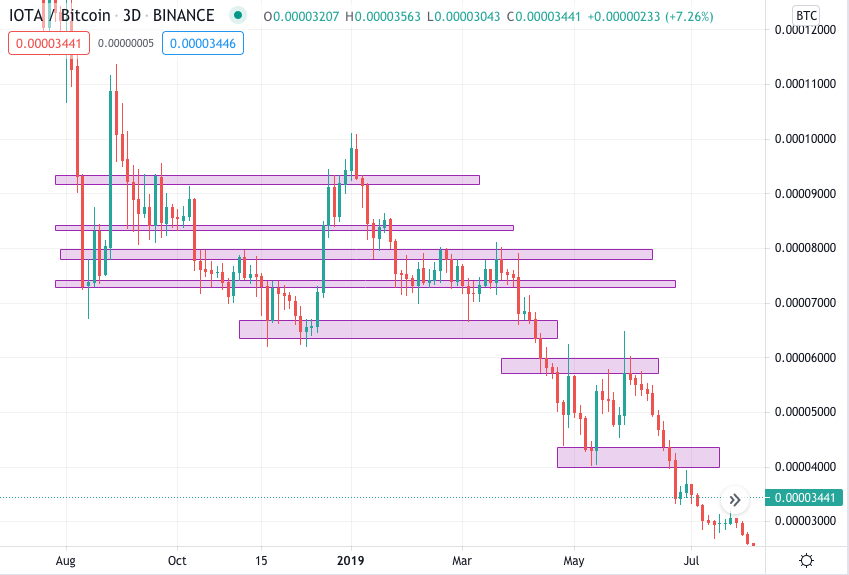
Of course, IOTA won’t stop at every single one of these points, but they can inform you on where to set your sells, especially when you zoom out to a higher timeframe:
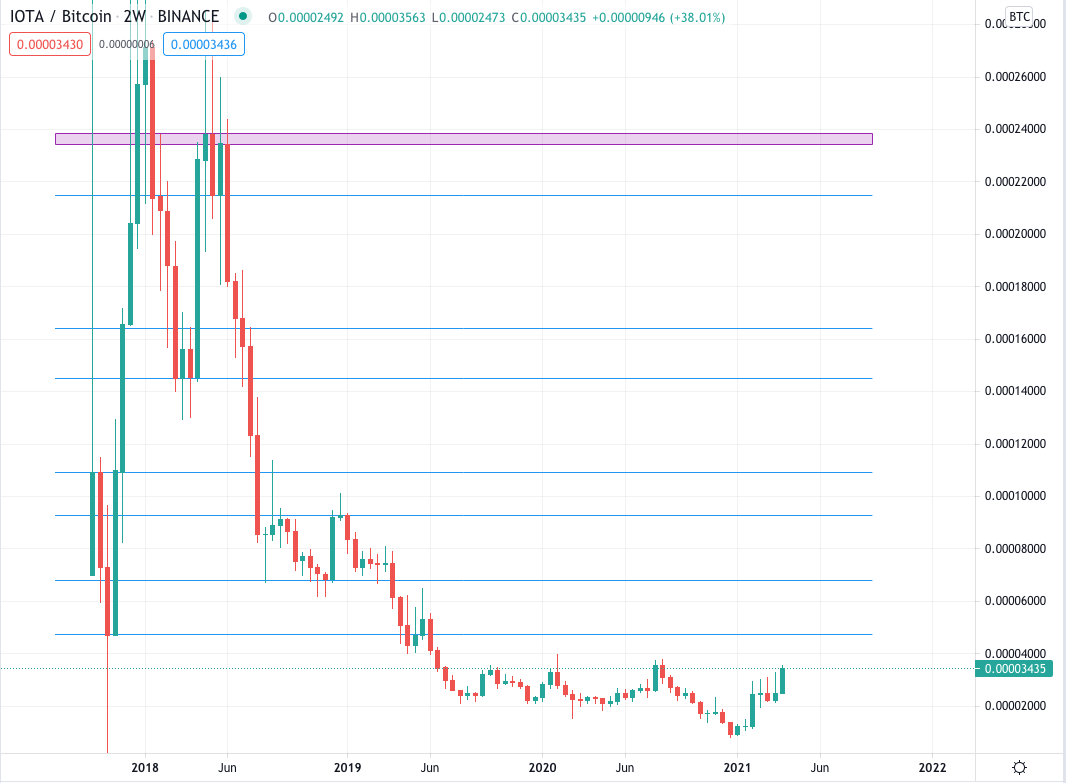
Using a two-week timeframe we can factor in the critical areas across IOTA’s history to inform where we can expect some resistance. An alternative way to discern potential take profit areas is to run a fibonacci retracement tool from the top of the prior bull run to where it bottomed out:
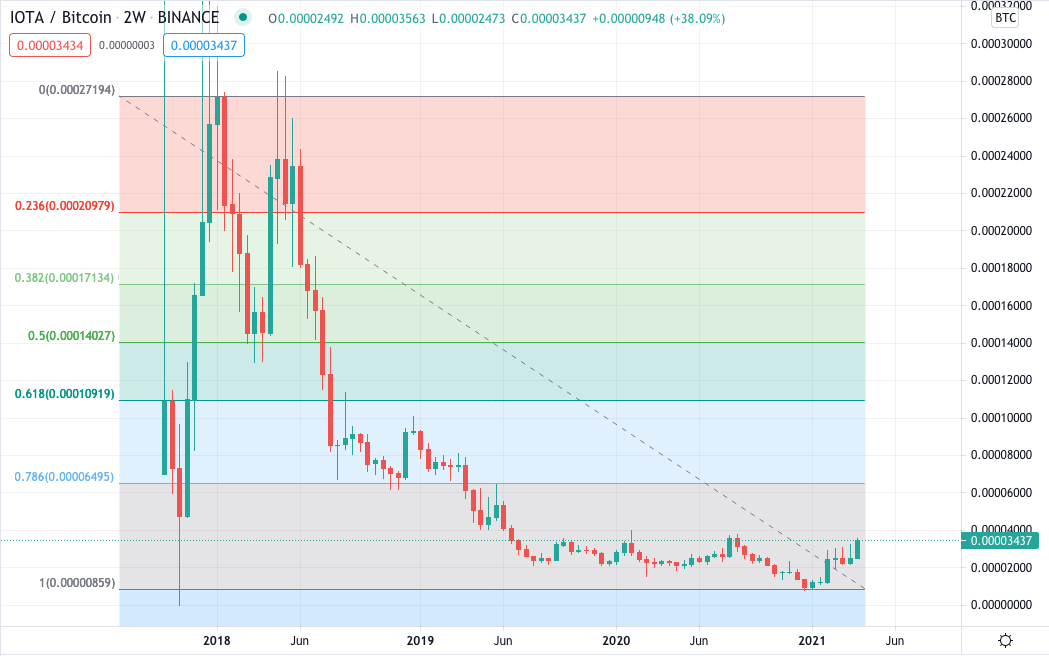
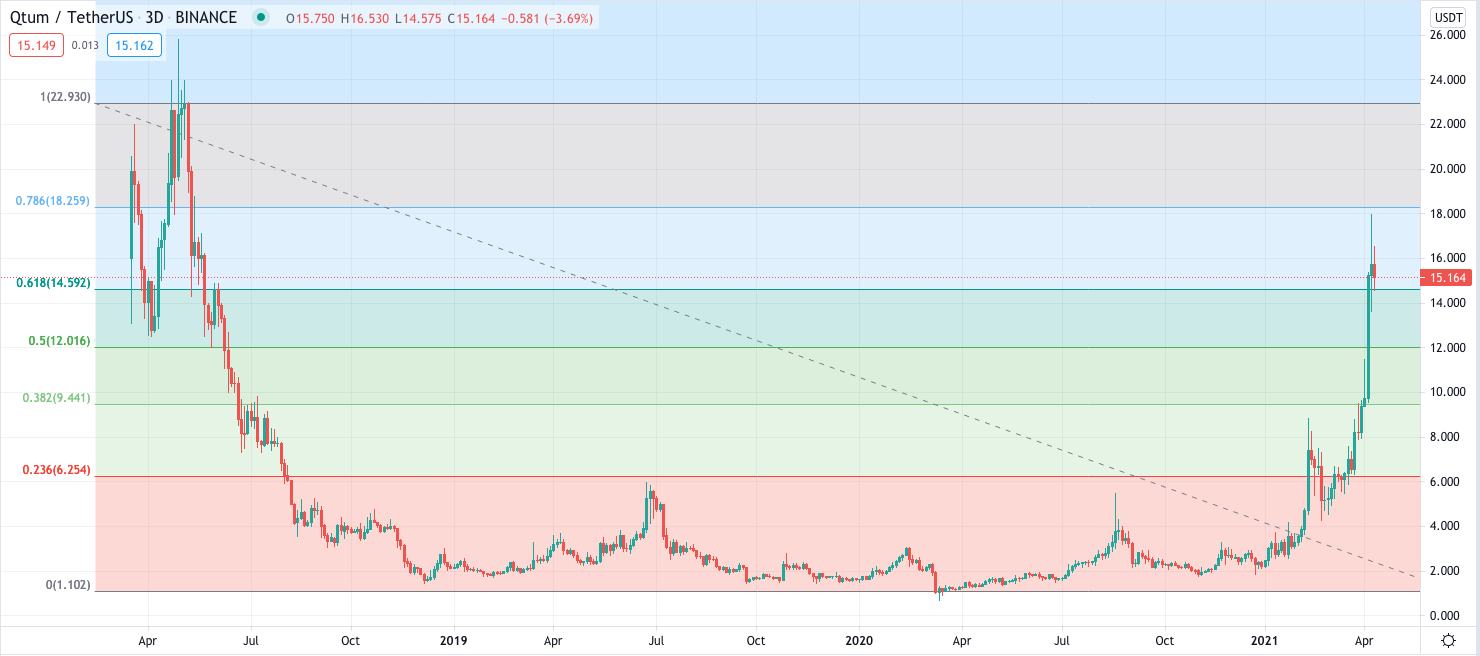
We can see that the lines almost match up in many areas, giving us a very clear idea of what IOTA could be about to do. Of course there is no saying that it will run all the way to the top, which is why it’s best to sell incrementally along the way, especially when it goes vertical. QTUM’s recent run against its USDT pair shows us this in practice:
If you spot an alt that has bottomed out against its BTC (or USDT) pair and has some good volume coming in but has yet to break past its long-term resistance level then you might just have found the next mega runner.