- Selling the top is something everyone aspires to do, especially in a Bitcoin bull run
- Pi Cycle Top Indicator is a great tool for spotting prior bull market tops
- Can we use it to predict when the next Bitcoin bull run will top out?
Predicting the end of a bull and bear market is where fortunes are made, but the fact that we’re not all millionaires shows that it’s damned hard to do. As we have already discussed, buying the absolute bottom and selling the absolute top is almost completely down to luck, but there are tools we can use to give an approximation of when the end of a Bitcoin bull run might be nigh.
Using The Pi Cycle Top Indicator
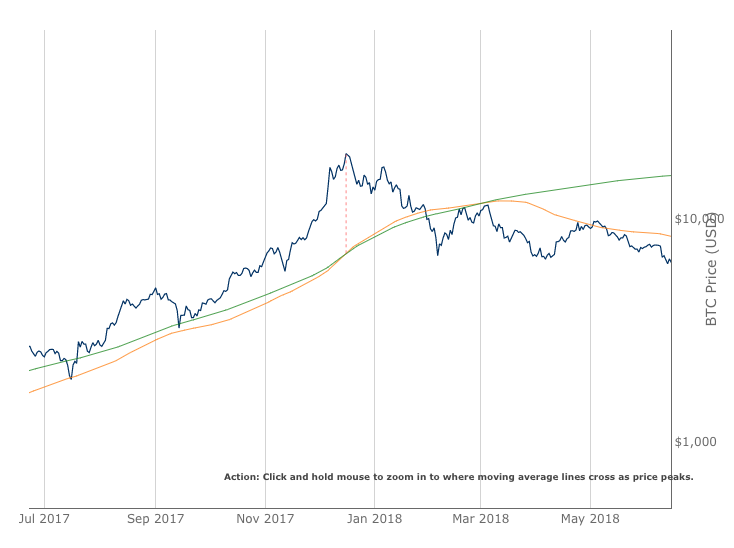
One of the most useful tools is called the Pi Cycle Top Indicator, which uses a combination of daily moving averages to ascertain when the Bitcoin price might be about to reverse:
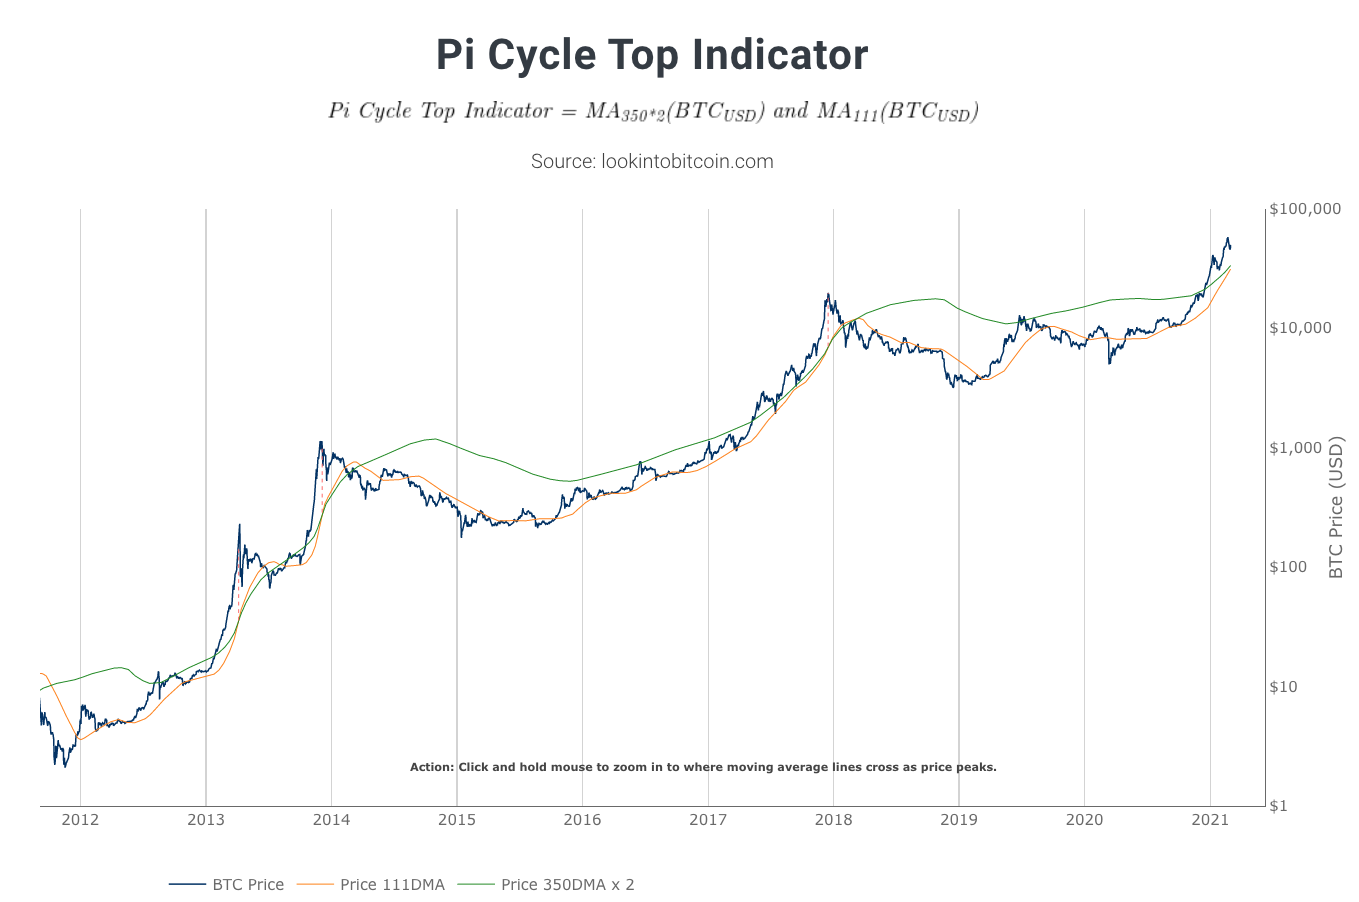
The Pi Cycle Top Indicator claims have “historically been effective in picking out the timing of market cycle highs to within 3 days”, so it’s worth taking a look to see if those claims stand up to scrutiny and to see if we can use it to see where the current run might top out.
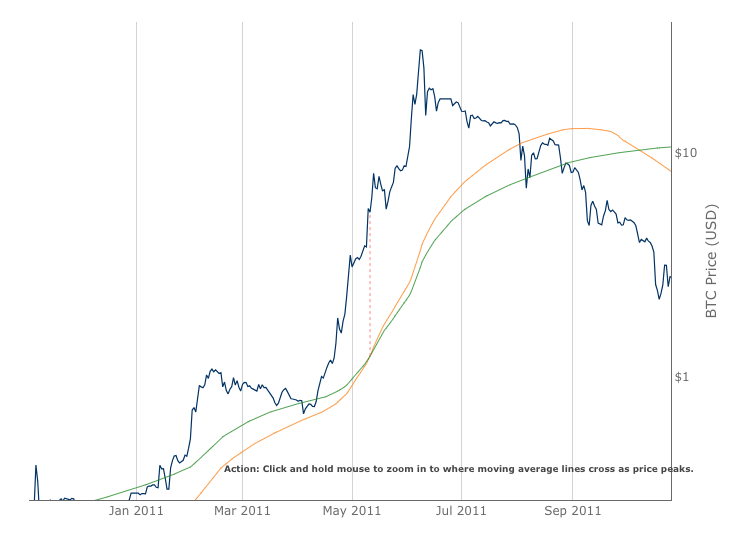
Looking at the first Bitcoin bull run in 2011, the Pi Cycle Top Indicator didn’t do a great job of picking the top, crossing at $5.44 on May 10 when the peak occurred on June 8 at $29.03:
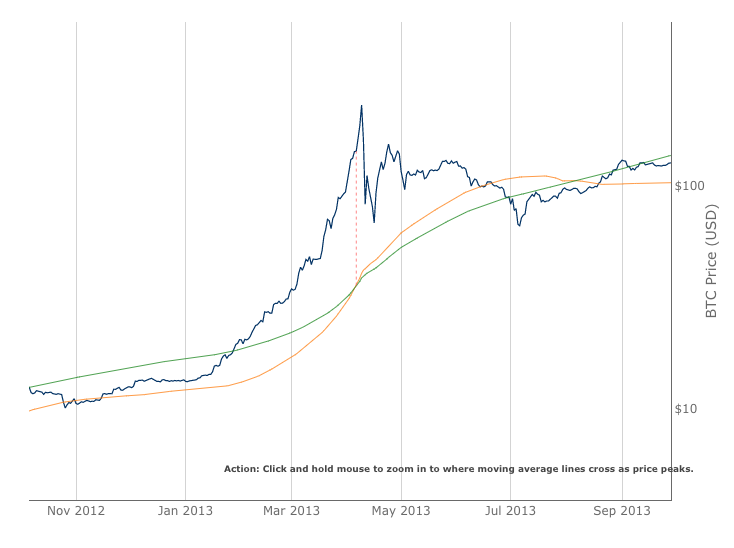
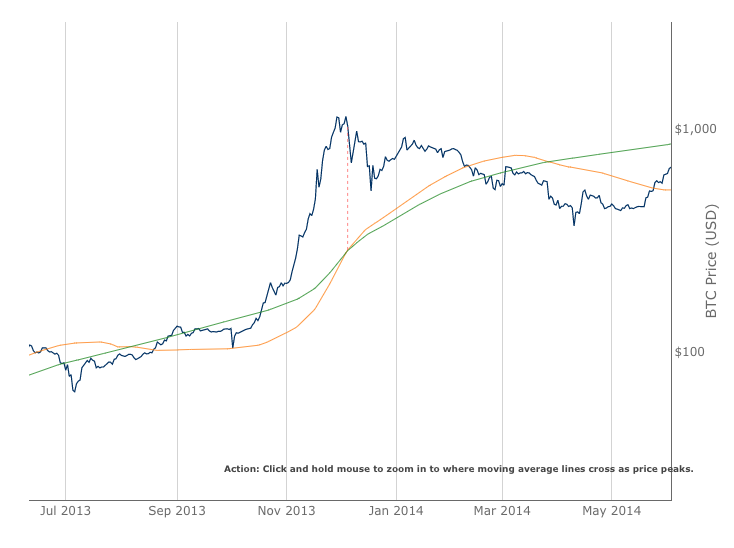
It fared better in the two bull runs of 2013, crossing on April 6 at $143.06, three days short of the $230 top, and then again on December 5 at $1,027.41, just a day after the top of $1,134.93:
If you’d have been using the Pi Cycle Top Indicator to mark the 2017 bull run you would have been advised to sell at $19,640 on December 16, the exact day that Bitcoin topped out:
As we can see, the Pi Cycle Top Indicator has become more and more accurate as time has passed, which is good news for those using it today, possibly because Bitcoin’s activity at those tops has become less volatile over time.
Predicting the Current Bitcoin Bull Run End
The big question of course is to see where we are in the current bull run. The tricky thing about using the Pi Cycle Top Indicator as a predictive tool is that market cycles typically extend in length with each passing one, meaning that simply comparing the degree of separation from the two markers from one year to the next may not be representative of how long is left in the current cycle.
However, comparison the current Bitcoin bull run to the most recent one may give us an idea of where in the general scheme of things we are, given that the crypto bull run ran from around September 2015 to December 2017:

These charts show that we are at the same part of the current cycle that we were in October-November 2017 of the previous cycle. Again, while we can’t use this to predict when the current Bitcoin bull run will end, what we can clearly see is that we are in the late summer-early autumn phase of the cycle, meaning that thoughts should be turning to an exit strategy (for those who intend on cashing out) given that the top could be just a few months away.