- There are many tools out there that indicate when a Bitcoin top could be in
- There is also one Bitcoin trendline dating back to 2011 that could be a very strong indicator
- The trendline has followed major support/resistance areas since it started
Everyone wants to know when the Bitcoin cycle will end, and there are a number of tools out there to give indications of that. We have covered one, the Pi Cycle Top Indicator, already, but there might be an even simpler way to work out what Bitcoin might have in store, and it comes in the form of a single trendline dating back to the November 2011 bull run.
One Bitcoin Trendline to Rule Them All
This Bitcoin trendline has its origins in the bull run of 2011, beginning when Bitcoin bottomed out after its run to $32. Its importance became truly apparent during the following bear market, where it traced the market bottom for some nine months until the 2017 bull run really took hold:
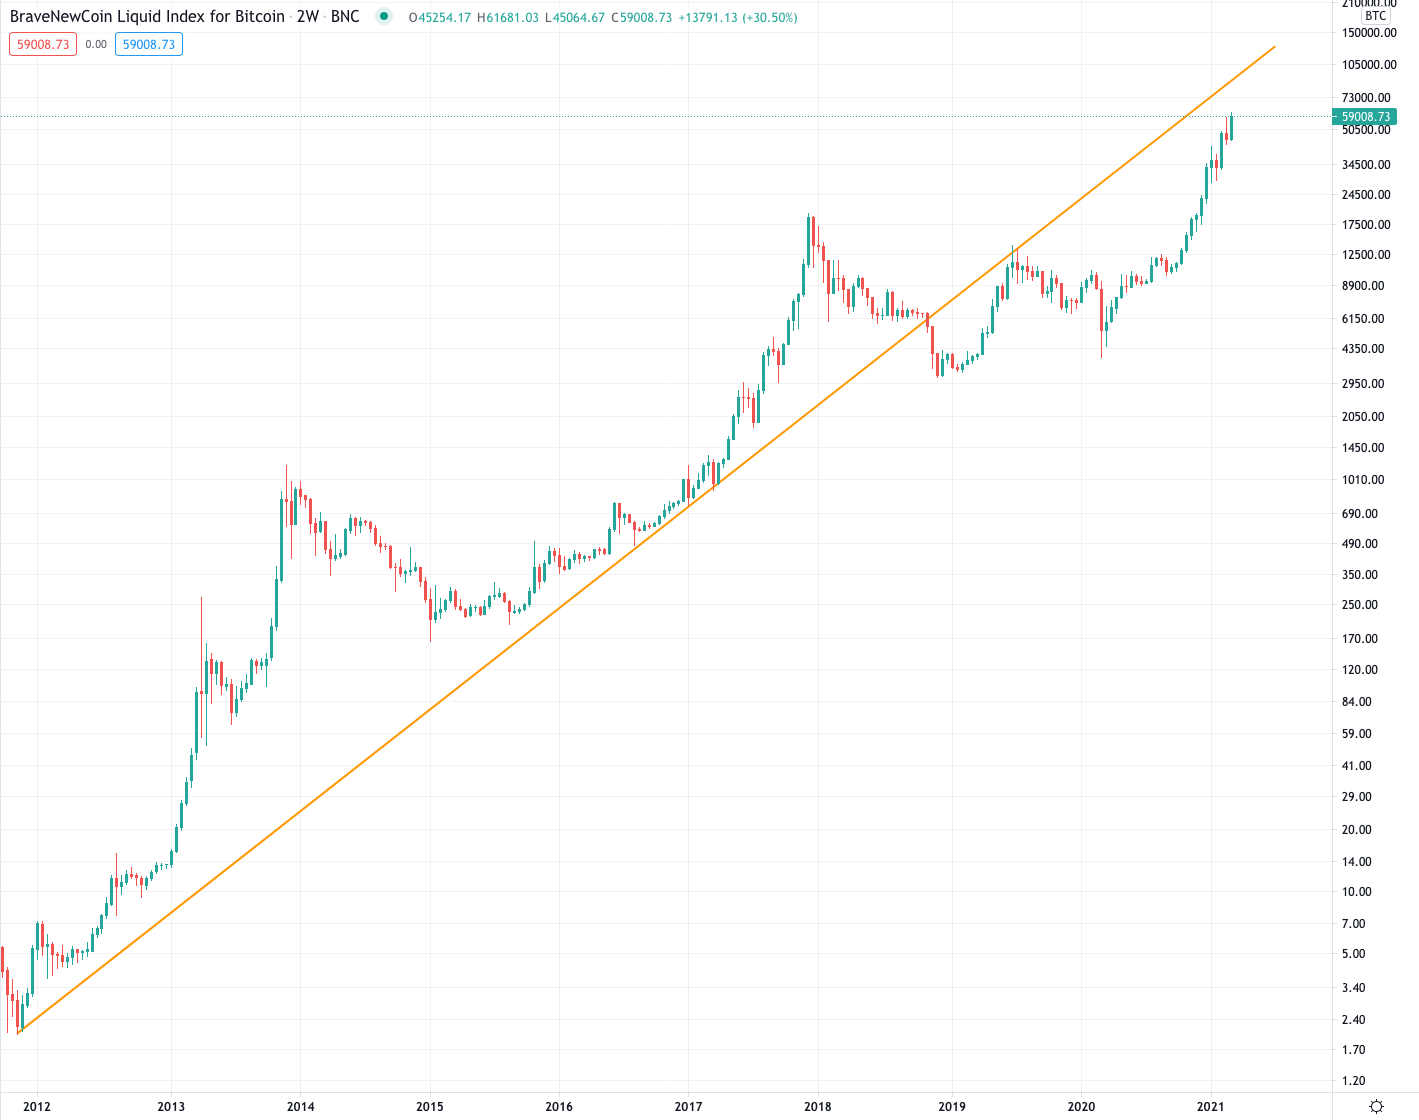
The next interaction the Bitcoin trendline had with price was in December 2018 when Bitcoin collapsed through it at $6,000, since when it has reflected resistance rather than support, doing so during the summer 2019 mini bull run. This was the last interaction price had with the trendline, but as we can see the current bull run has seen it closing in once again. The question is of course, what will happen when we touch?
Support or Resistance?
If this Bitcoin trendline had reflected support or resistance 100% of the time since its inception then we would have a good idea of what to expect. However, seeing as it flipped from support to resistance in 2018 it’s much harder to tell.
In order to have a guess at which way it will flip we need to look at what the situation will be when (or if) Bitcoin eventually reaches that trendline. Right now Bitcoin looks on the verge of going parabolic, or at least continuing its upward trajectory, and if this happens then price will interact with the trendline close to the six figure mark around May. This would mark a perfect top in terms of sentiment as well as on many long-term Bitcoin growth charts, and would mean that Bitcoin has been in a bull market for over a year. Given these facts, the odds of flipping the trendline and using it as support again are much slimmer than it acting as resistance for the second time.
Taking profit at interaction of price with the Nine-year Bitcoin trendline would therefore be a sensible move, if you plan to sell at all. If price were to reject then you have locked in your profits and can use them in the altcoin season that will follow, whereas if Bitcoin were to flip this trendline and use it as support once more then we could be looking at the kind of numbers that even the biggest Bitcoin bulls could never have dreamed of. All you would need to do is buy back in once the resistance/support flip was confirmed and you haven’t lost out.