- When a Bitcoin bull run really gets into gear, the big question is always “Where will it top out?”
- There is a specific tool we can use to predict where Bitcoin might top out
When a Bitcoin bull run gets going, everybody wants to know the magic number at which they can cash out, knowing they have sold the top. Only a handful of people ever manage this, but there are tools available that can help predict where Bitcoin might mathematically finish its bull run. Let’s examine this tool, compare it to the last bull run, and see what it says about the current one.
How the Fibonacci System Works
The tool we can use to predict the future price of an asset is called the trend-based Fibonacci extension. The theory behind the trend-based Fibonacci extension tool is rooted in the Fibonacci sequence, a series of numbers where each number is the sum of the two preceding ones (0, 1, 1, 2, 3, 5, 8, 13, and so on). This sequence has mathematical properties that appear in various natural phenomena and financial markets.
In financial markets, traders apply Fibonacci ratios (derived from the Fibonacci sequence) to identify potential levels of support and resistance. The key Fibonacci ratios used in the extension tool include 1.618, 2.618, and 4.236.
The tool assumes that after a significant price move in one direction (the trend), the market may experience a retracement before continuing in the original direction. The retracement levels (typically 0.382, 0.50, and 0.618) represent potential areas where the price might reverse or consolidate temporarily.
By extending the Fibonacci levels beyond the end of the trend, traders can project potential future price targets or areas of interest. These extension levels serve as guides for traders to anticipate where the price might encounter support or resistance as the trend unfolds.
The theory suggests that market participants are influenced by these Fibonacci levels when making trading decisions, leading to clusters of orders around these levels and causing price reactions. Therefore, traders use the Fibonacci extension tool to identify strategic entry and exit points, set profit targets, and manage risk within a trending market.
The Numbers
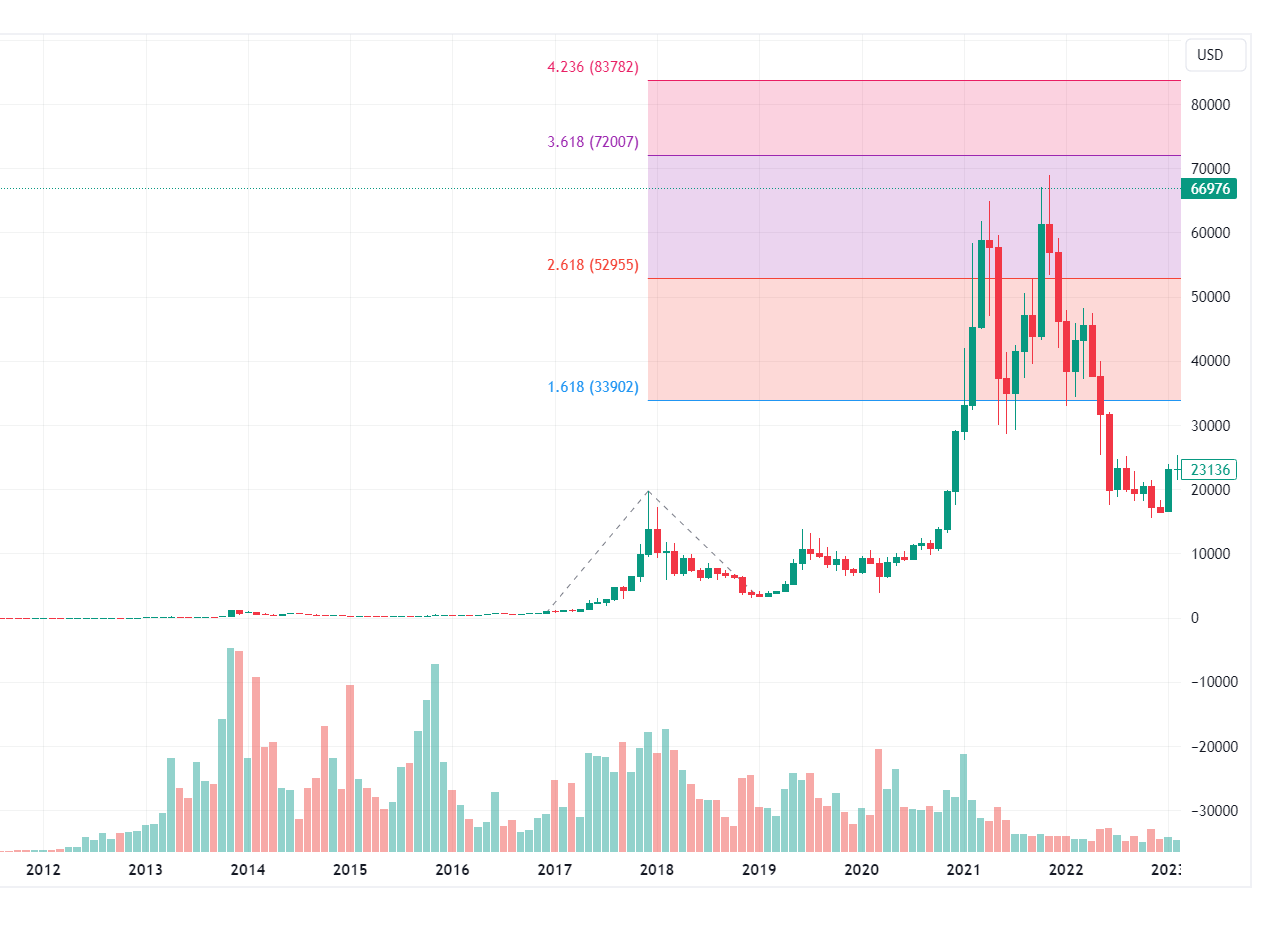
So how does the Fibonacci extension theory apply to Bitcoin? Let’s see how it played out when predicting the 2021 top:
As we can see, Bitcoin passed the 2.618 line but the 4.236 was, understandably, out of reach. This suggests that we should be dealing with the 1.618-3.618 region. If we apply that logic to the current position (using a logarithmic graph this time) here’s what we see:
Here we see some plausible topping-out points for Bitcoin, starting with $120,000 and going all the way up to $250,000 if we are to echo its performance from 2021.
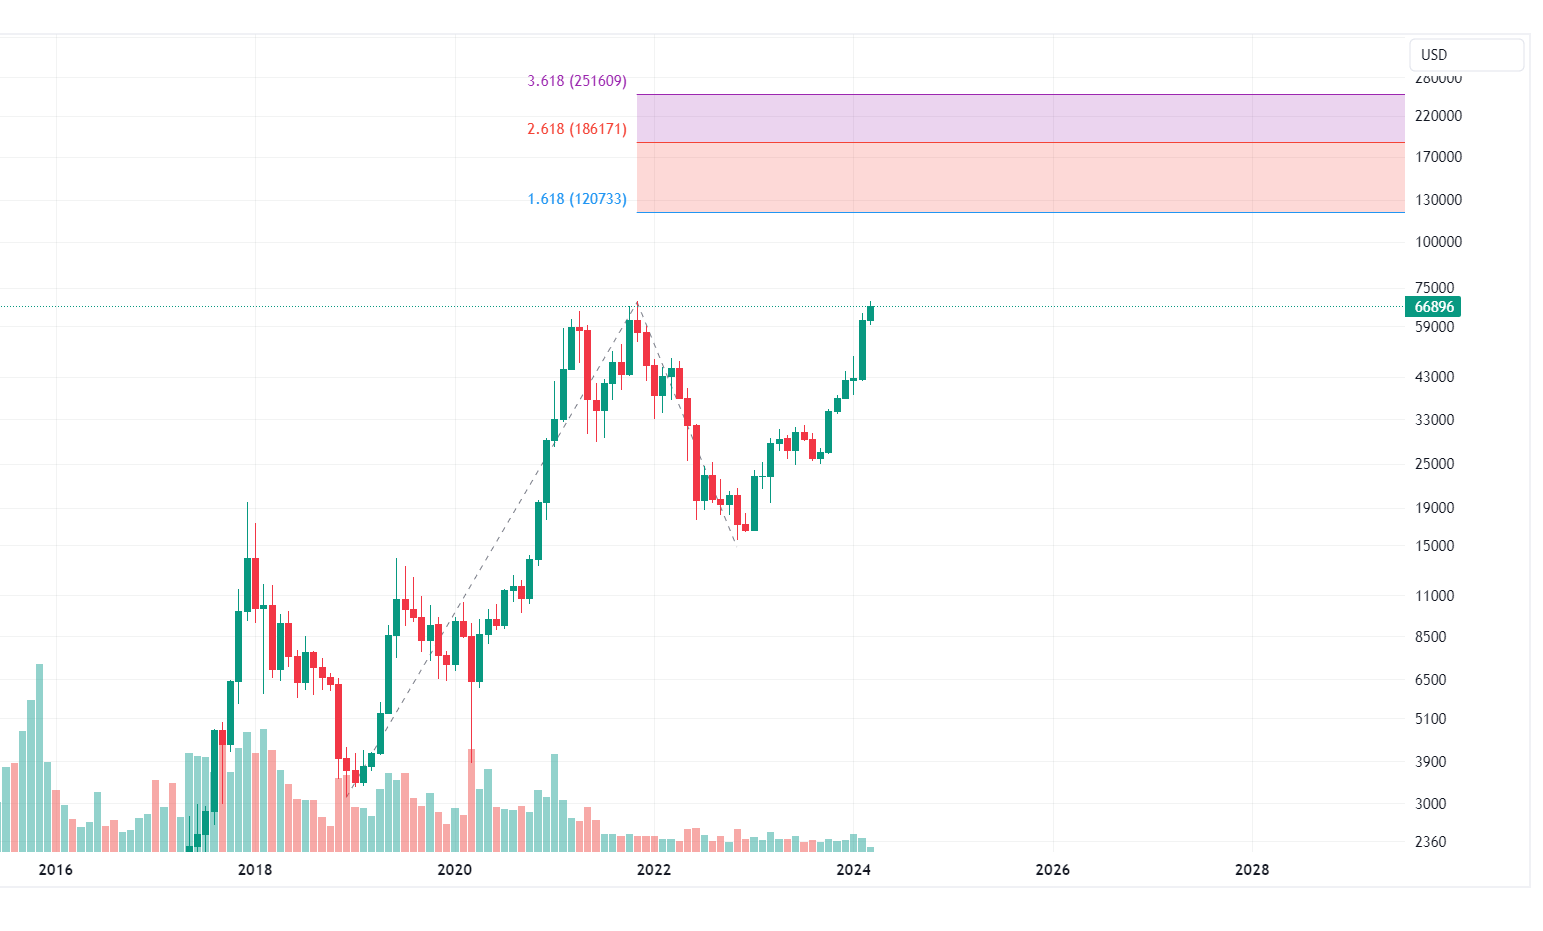
Of course, these numbers are speculative and are far from set in stone, but they are something to bear in mind given that this is what Bitcoin has experienced in prior bull runs.