- Bitcoin made a $100 move yesterday that could signal the next bull market
- There are four separate indicators of a potential pump coming
- Alt season shows money is ready to come in
Bitcoin enjoyed a relatively minor $100 jump yesterday, but the knock on effects could help usher in a new bullish cycle. We break down four separate indicators that all show how Bitcoin could well be set for the next cycle that we have all been waiting for.
Bitcoin Breaks Out Of Downward Channel
The first example is the breaking out of a downward channel than has been in evidence since Bitcoin failed to hold $10,400 in early June:
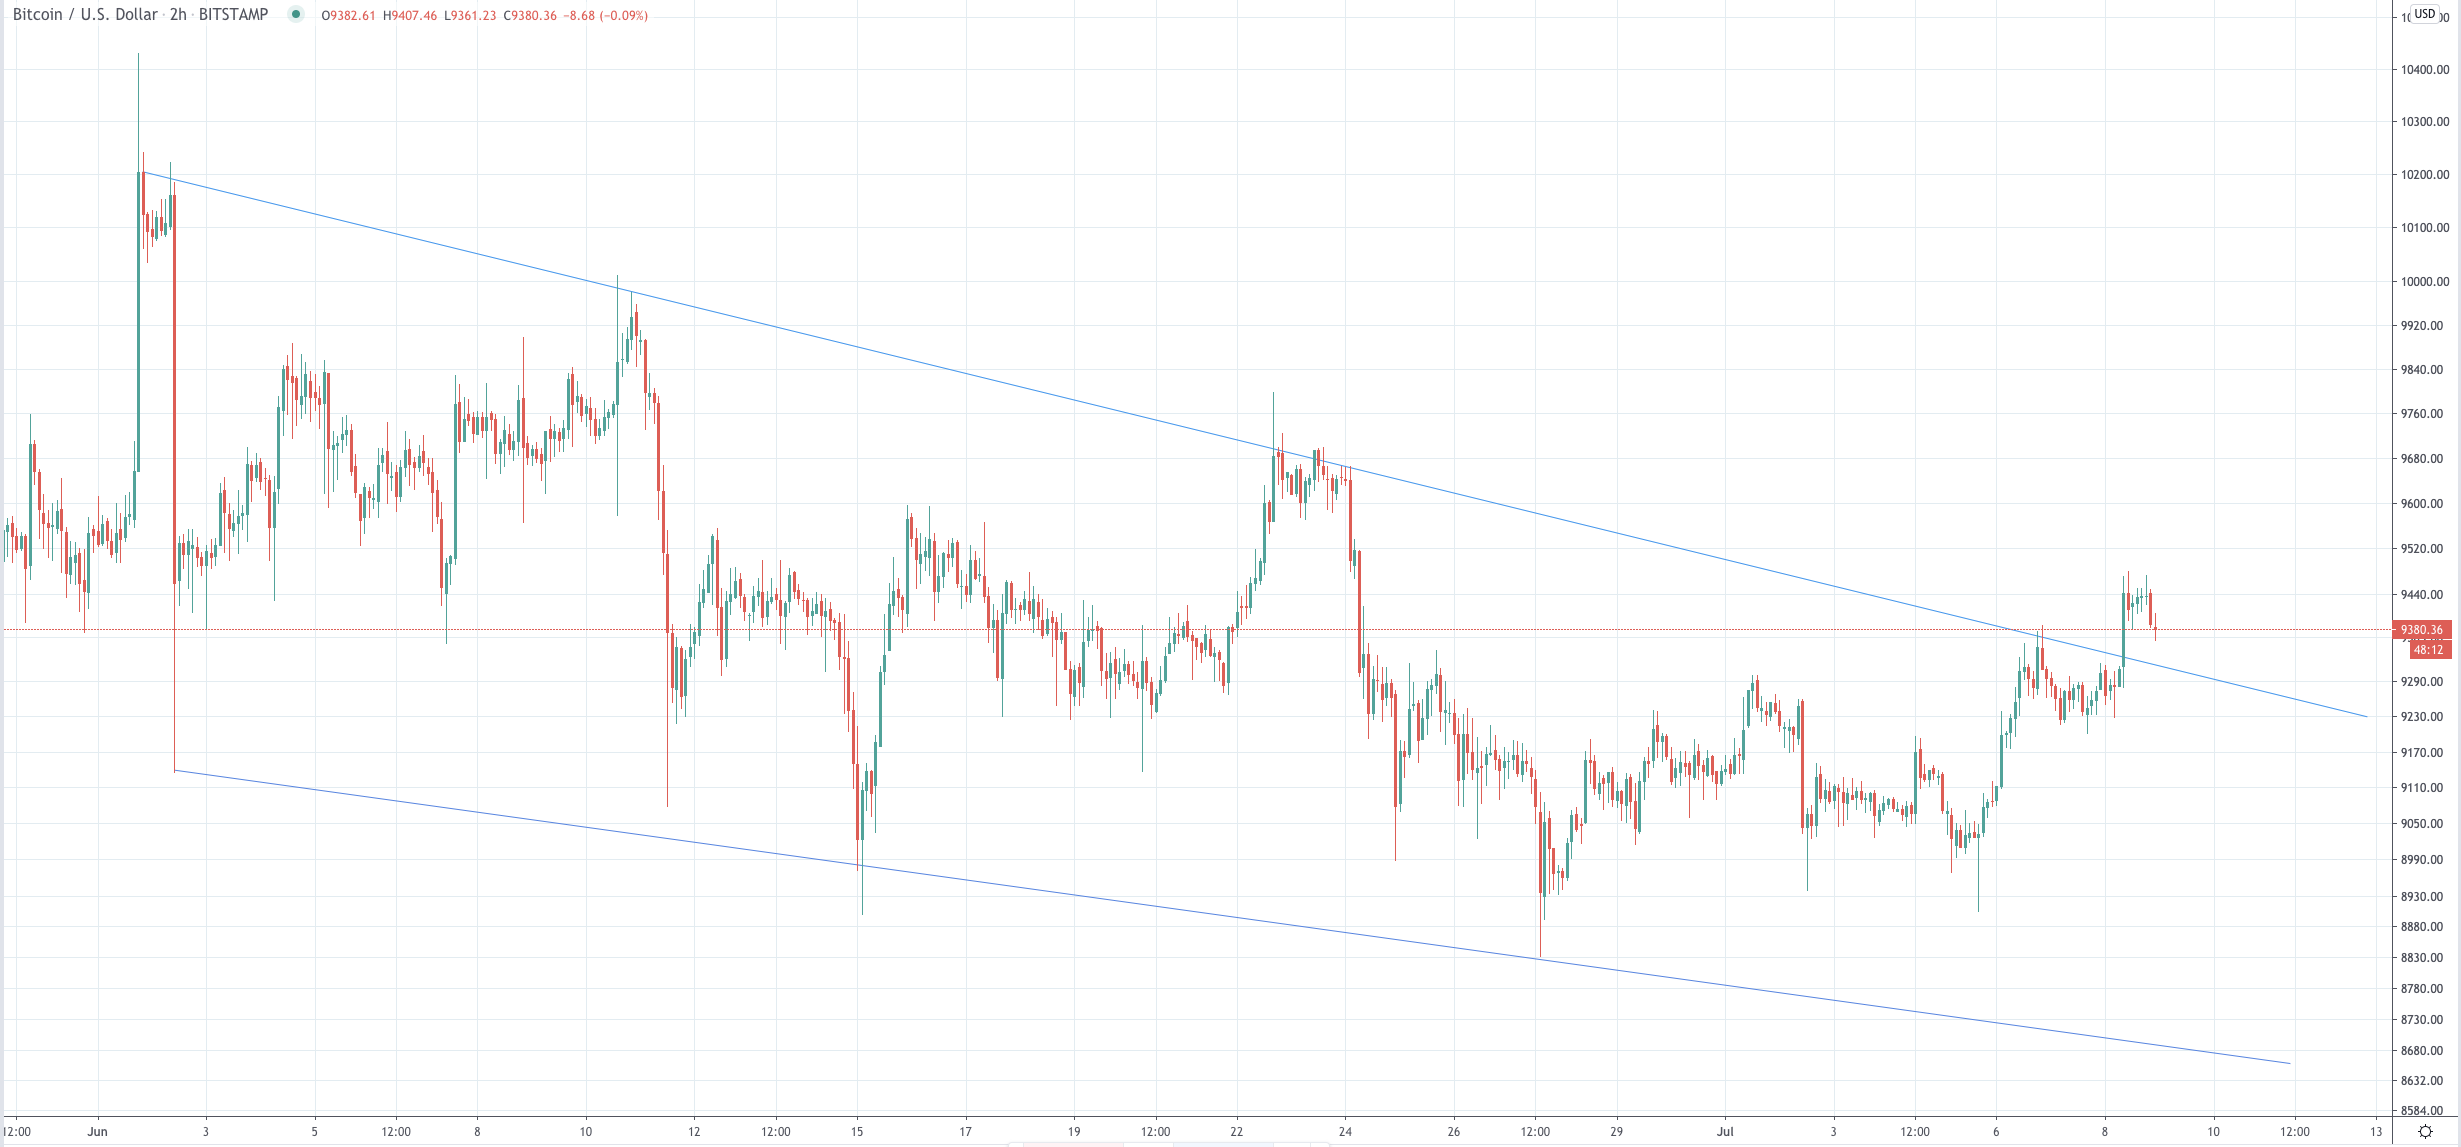
We can clearly see that Bitcoin has now jumped the resistance and, crucially, has closed above it on the daily timeframe. This is a great sign that we could be on the first steps towards a re-test of the $10,000 area, as long as we can stay above the channel in the coming days.
This sentiment is echoed by a similar chart, which uses the same line of resistance within a wedge:
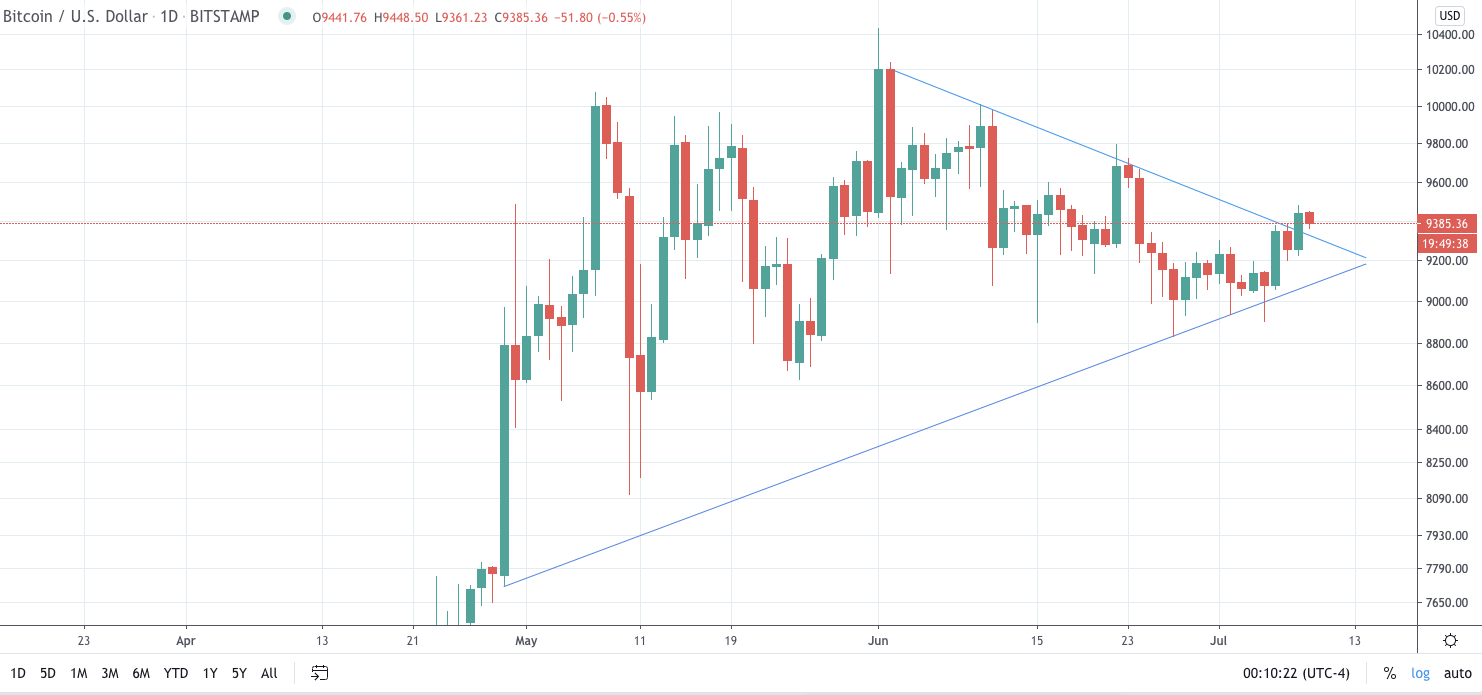
Here we can see that the support has been tested a few times in the past week or two but has never closed below it, which is always a bullish sign. After a few failed attempts at breaking out through the top of the wedge it has finally done so, echoing the sentiments of the channel break above.
20-day Moving Average Signals Bull Market
Thirdly we can look at the 20-day moving average (20MA) to give us a gauge of whether we are in a bull or bear market:
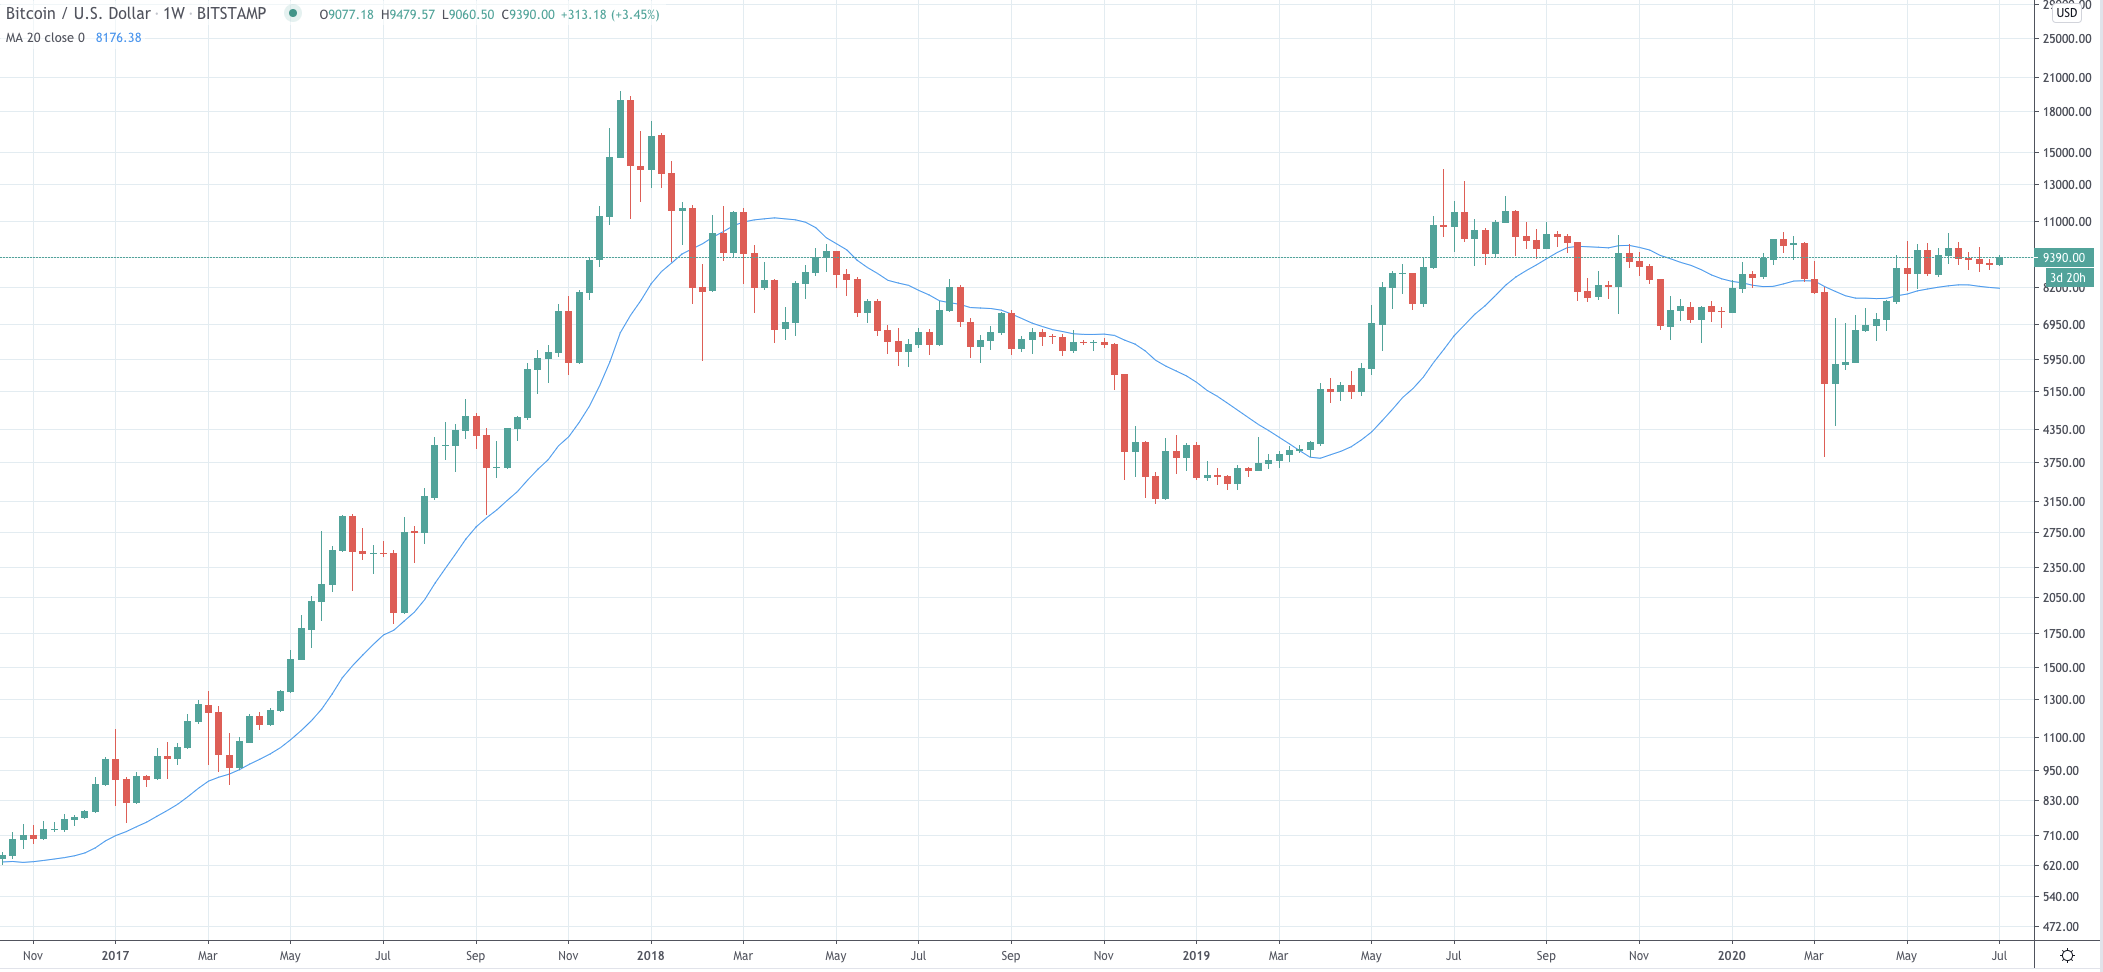
Traditionally, when Bitcoin is above the 20MA it is in a bull market and when it is below it is in a bear market. Of course, the price needs to be above to 20MA for a reasonable amount of time to suggest that it is little more than a blip, and while there is no set amount of time to definitely signal this, Bitcoin has now rested above the 20MA for over two months, resuming the same position it held pre-crash.
This suggests that had it not been for that anomaly Bitcoin would in fact have maintained this position above the 20MA for the whole of 2020, a definite sign of an impending bull run.
Echoes of 2018-19
The final way we can judge Bitcoin’s potential moves is to compare its current position to past similar occasions:
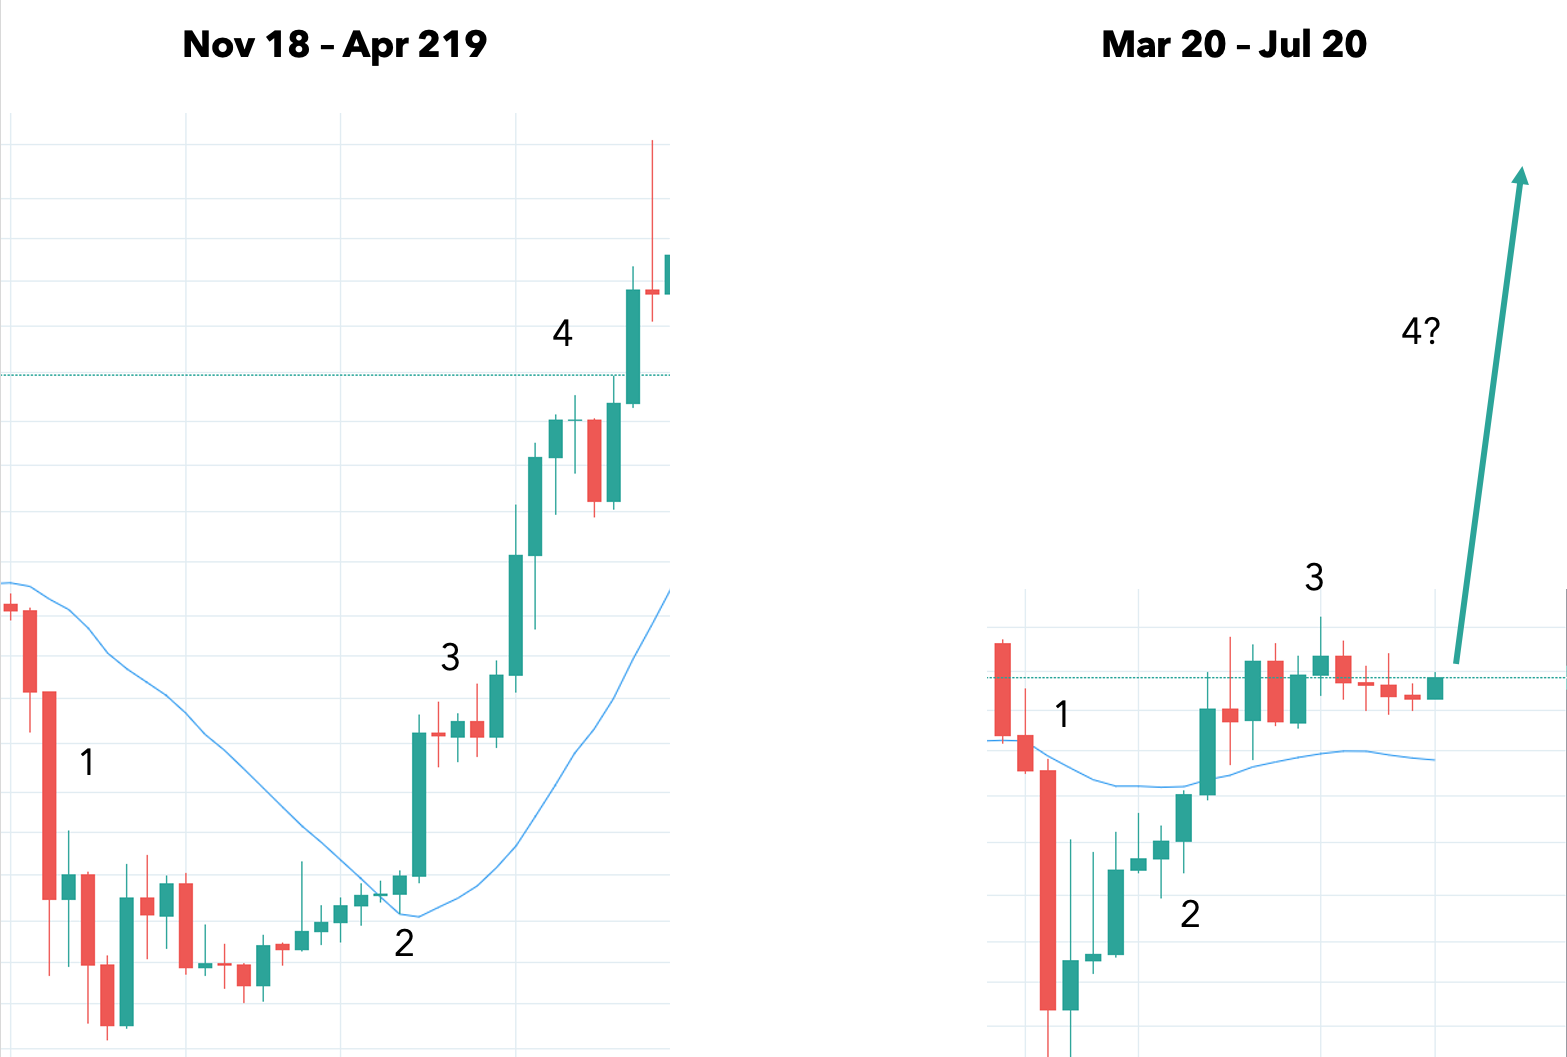
November 2018 saw a dramatic collapse of the Bitcoin price from $6,390 to $3,120 in a little over a month, similar to what we saw in March (point 1). What we saw following this was a rebound up past the 20MA (point 2) followed by a plateau above this (point 3). Then Bitcoin raced from $5,000 to $13,300 in around eight weeks.
Looking at the price action from March, we can clearly see the drop, the rebound, and the plateau above the 20MA. As we have seen, this indicates that Bitcoin is certainly in bull market territory, and suggests that a parabolic move could well be the next move up.
No Guarantees, But Bitcoin Looks Good
Of course, technicals are not predictors of what will happen and are more of an indication of what could happen based on current data. Whichever way you look at it, it cannot be denied that Bitcoin is in a bullish-looking market, and it is rare that four very different points of view all correlate to suggest a single direction – up.