- Clem Chambers, entrepreneur and Bitcoin writer, has claimed that Bitcoin’s market cycle is coming to an end
- Chambers believes that an 80% correction is on the cards after Bitcoin’s run to $42,000
- What do the charts, and Bitcoin history tell us about what to expect next?
British entrepreneur, blockchain author and CEO of DeFi project Umbria has told FullyCrypto that he thinks Bitcoin’s run is almost over for this cycle and he’s expecting a large scale correction. What do the charts and history tell us about where Bitcoin is in its long term cycle – could this be the end of the line for four more years, or is this just a bump in the road?
Chambers: 80% Correction Imminent
Chambers was speaking during a forthcoming episode of the FullyCrypto podcast during which he stated that the current cycle, which either began in July last year or in January 2019 depending on where you place the March 2020 collapse, is close to its completion following its runup to $42,000 a month ago. Chambers stated his belief that another four-year market cycle would now begin, potentially with another 80% correction the likes of which we commonly see when a Bitcoin bull run ends.
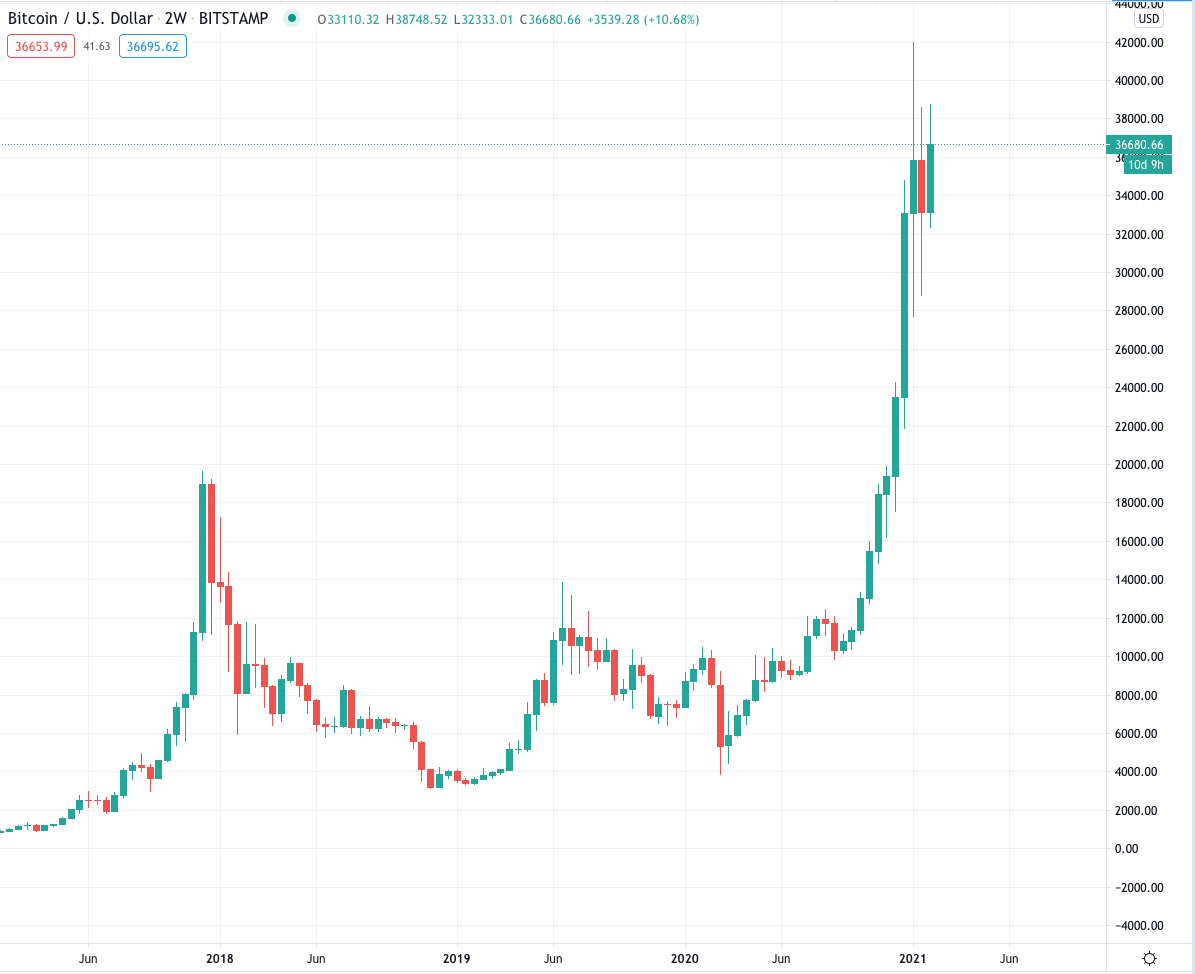
There are certainly parallels we can draw between prior bull runs and what Bitcoin has just experienced, and indeed when you look at the naked chart, a huge pullback seems almost inevitable:
Looks can be deceptive however, as we can see if we take a look at a sample chart from the prior bull run:
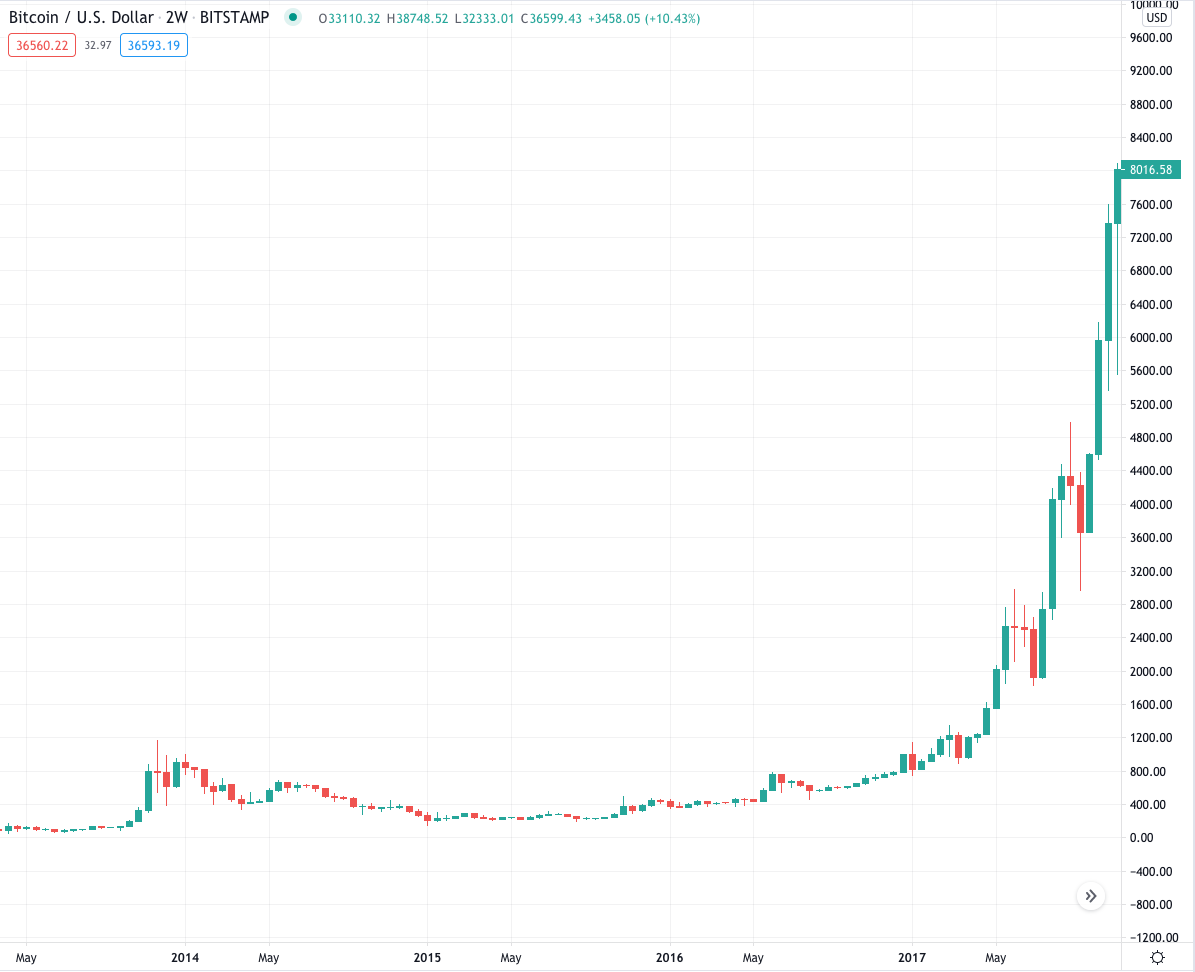
Bitcoin investors might have been tempted to sell at $8,000, thinking that the top was in after a near four-year cycle followed by a parabolic move. As we now know however this would have been a huge mistake:
Further, a look at the logarithmic chart shows that the growth we have seen so far in this cycle is nothing like as explosive as we would expect from the end of a bull run:
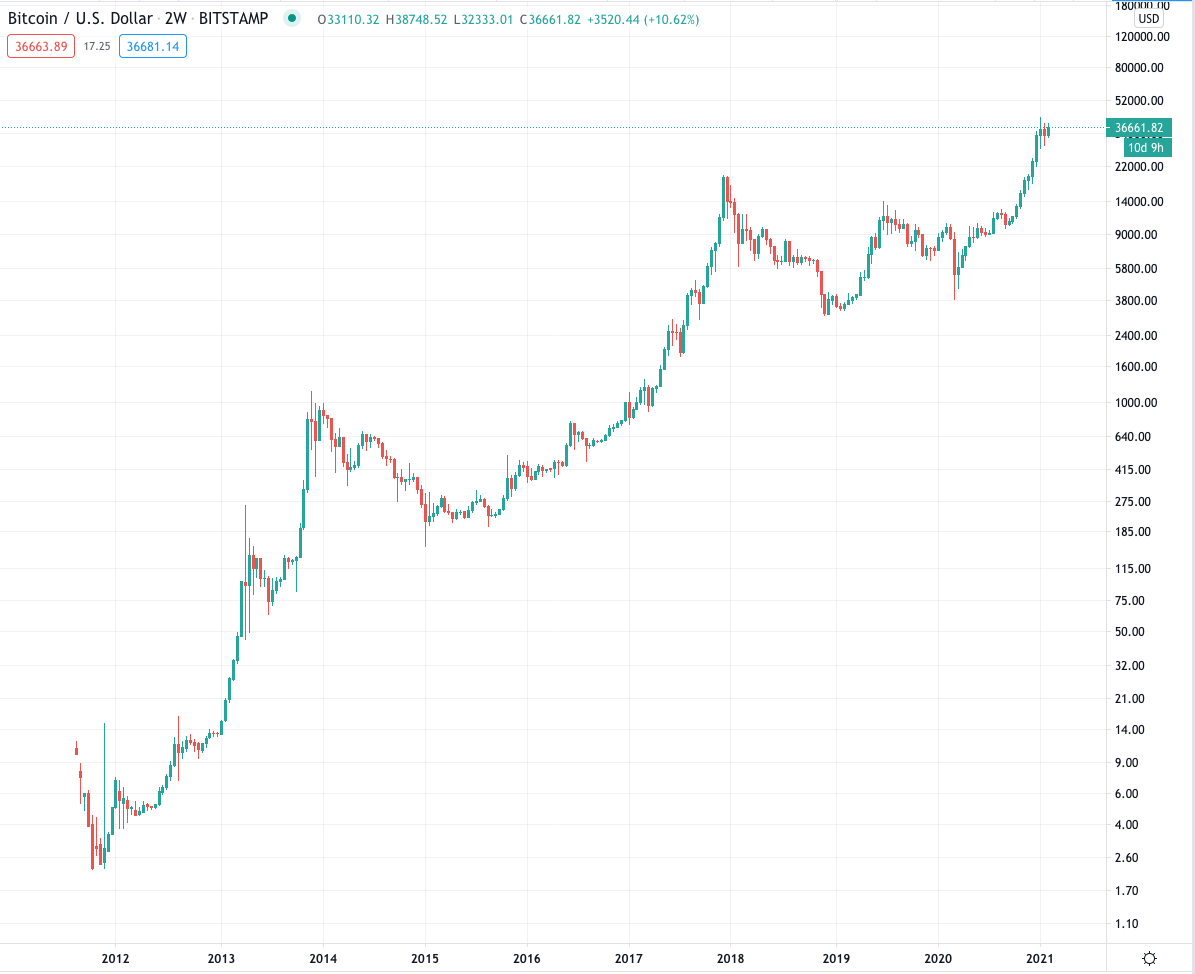
Indeed, this looks more like one of the many corrections experienced on the way to a bull run top out than a topping out itself. There are other longer term charts that we can look at to analyze where Bitcoin truly is in its cycle, such as the logarithmic growth curve:
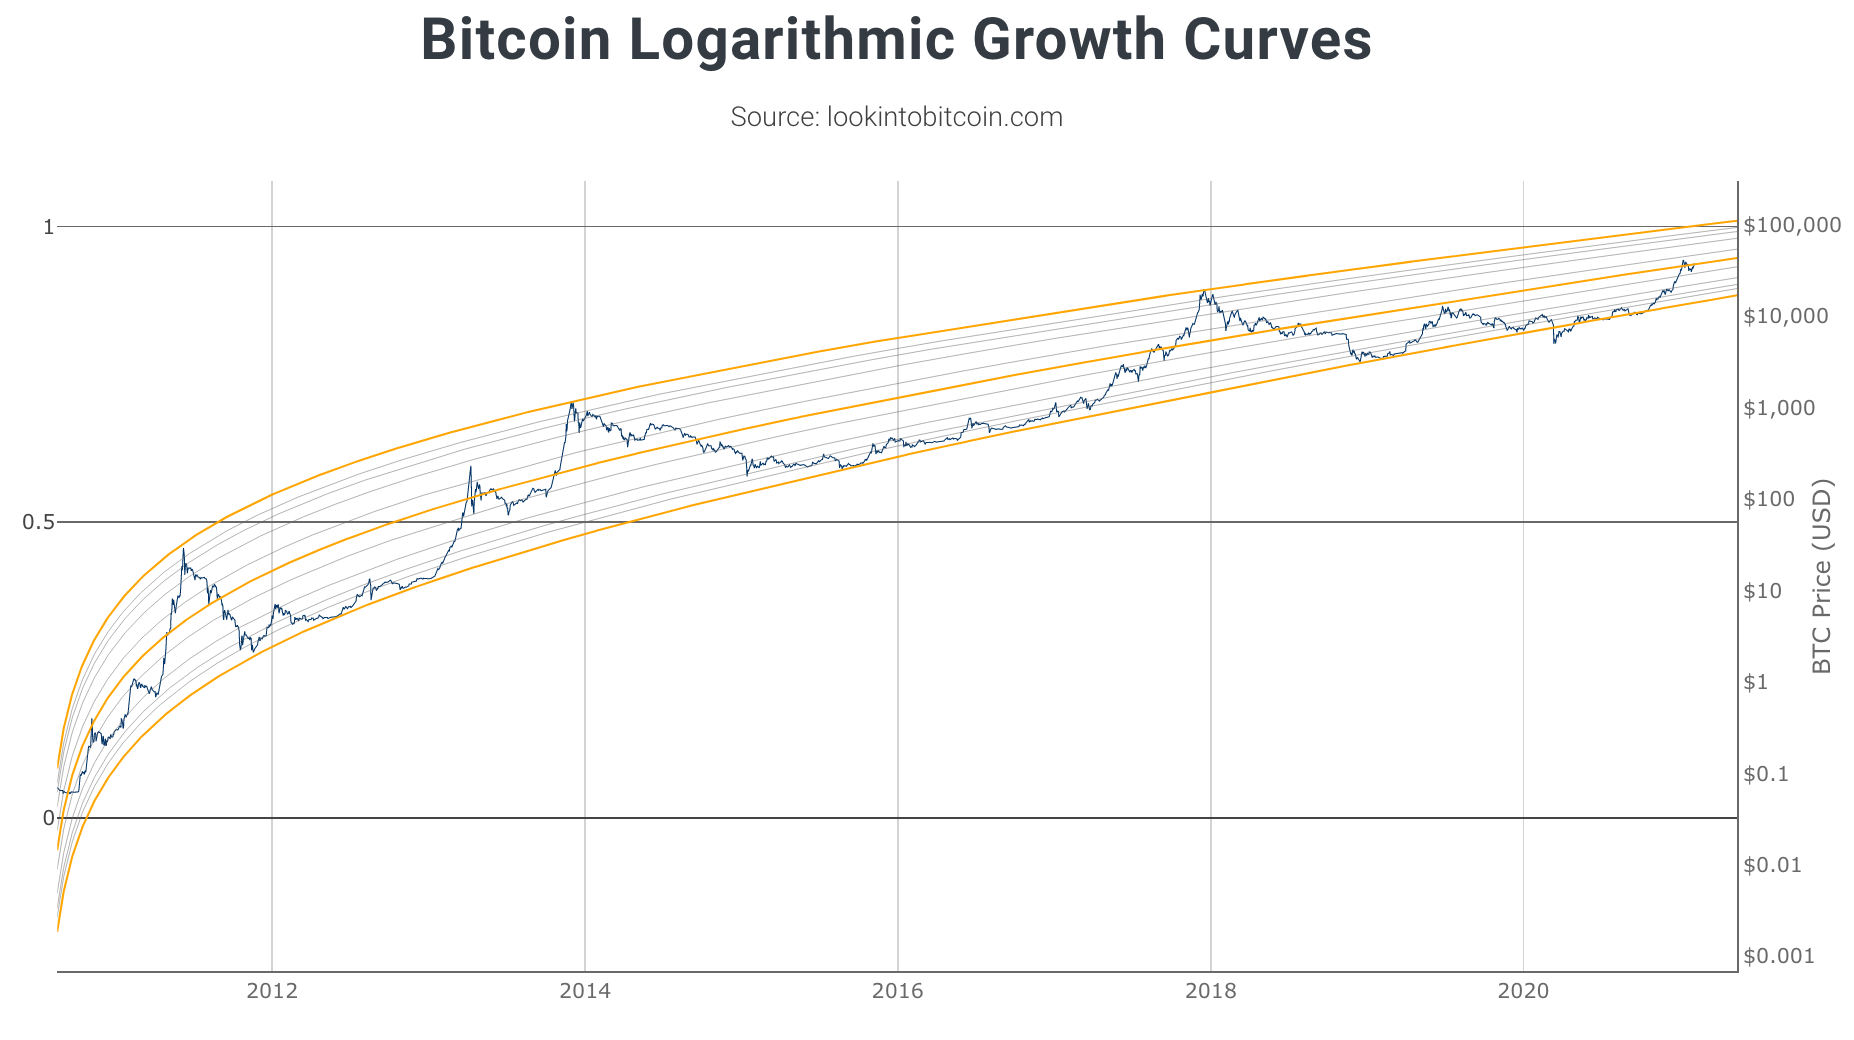
As we can see, this chart shows that we are at the mid-band, which historically, when approached from below, accelerates towards the upper band, if not right away then certainly within a few months. Bitcoin rejected once from the mid-band in 2019 and has already rejected once at $42,000. A third rejection is of course not unthinkable, but history tells us that it is more likely to break through and continue toward the upper band, especially because as it is retesting so soon.
Even if it does reject here and go back to the bottom band it is unlikely that it would signal the end to the entire run , leaving holders waiting another four years before trying again, especially with the fundamentals surrounding Bitcoin at the moment.
History Doesn’t Tally With 80% Bitcoin Correction
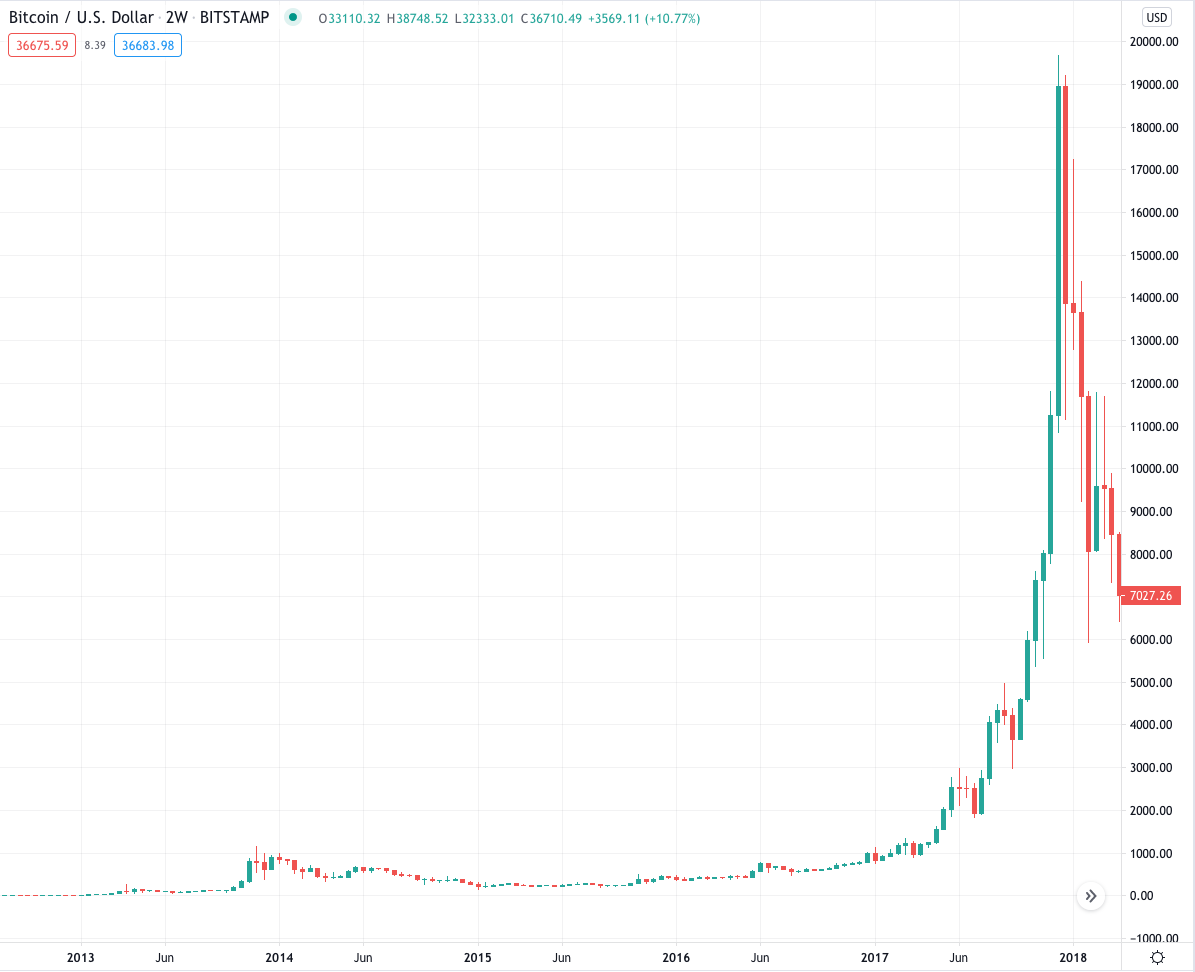
We can even compare previous market tops with what we are seeing at the moment:
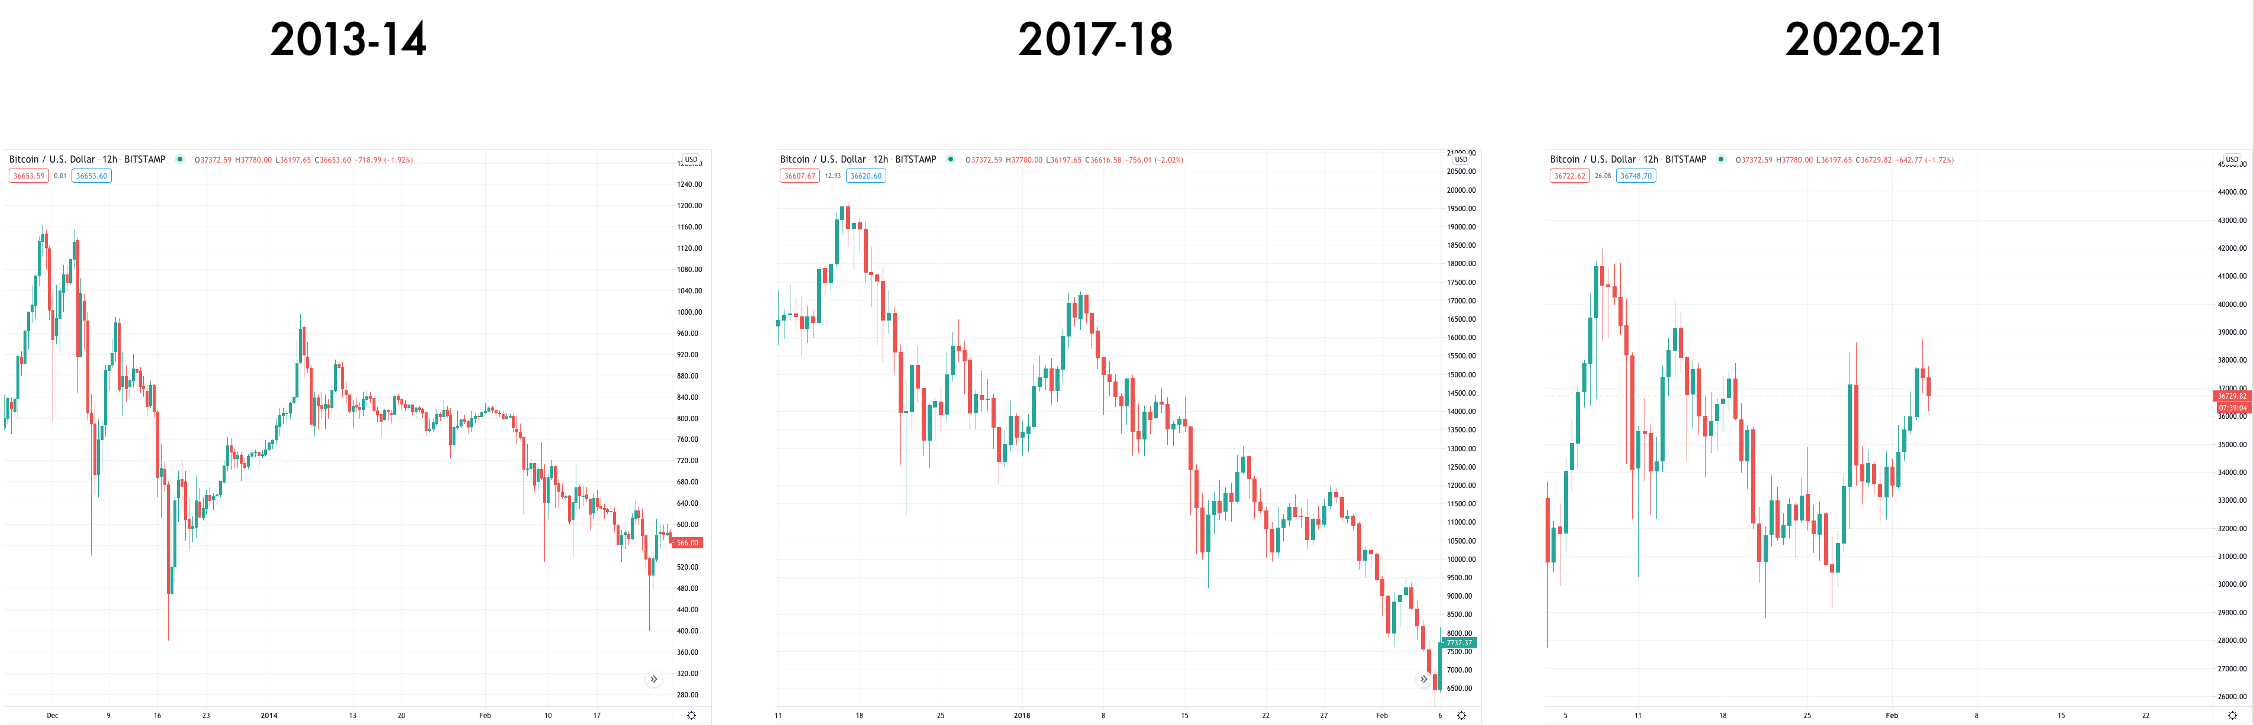
Both 2013/14 and 2017/18 saw immediate 50% drops or more after their peaks were hit. These were followed by dead cat bounces which topped out to form a lower low before Bitcoin descended into a bear market.
Bitcoin’s post-high drop at the start of the year was 28% by comparison, and this has been followed by a bounce back up to $38,000. Crucially, this has taken in a higher high followed by a higher low, which is symbolic of an uptrend. 30-40% corrections are typical in a Bitcoin bull market, corrections which are bought up and sent higher, whereas post-top bounces are quickly sold into, sending Bitcoin lower.
Of course there is still time for the current bounce to fail and to be turned into a dead cat, but more indicators suggest that this is a pullback on the way to higher highs than a final chance for holders to get out before the break market.