Bitcoin’s bull market has pulled back from a boil to a simmer in the last 48 hours, with some wild price action leading to BTC jumping and then retracing $430 in a matter of minutes yesterday. The event has brought a bearish sentiment back into the marketplace, with many believing that the next leg will be downwards.
Bitcoin’s Crazy Day
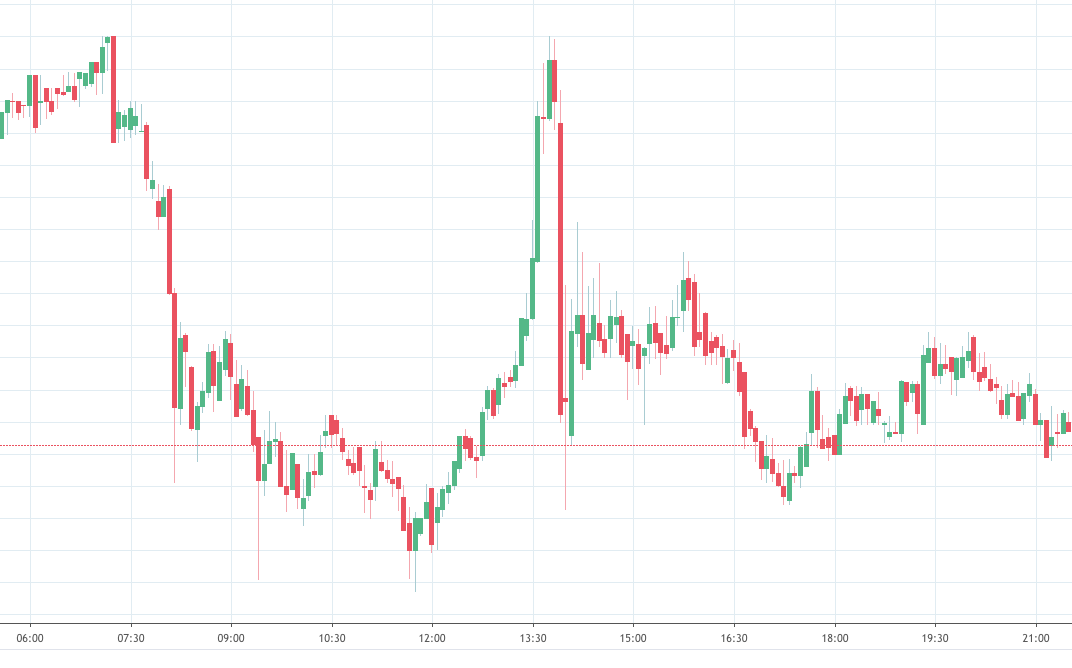
Bitcoin’s crazy day yesterday began with a rapid drop from $10,500 to $10,070, which was followed by an even quicker leg back up to $10,500 again. Amazingly, this was followed by an even quicker descent back to $10,130 (15 minutes according to the below 5-minute chart):
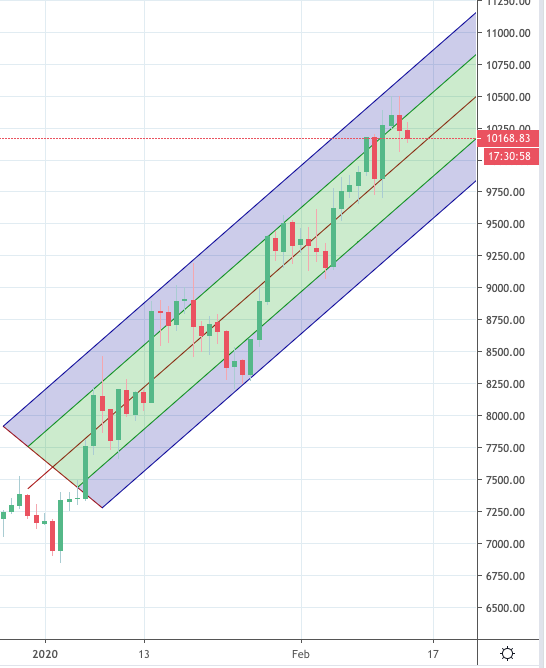
Thankfully, BTC has since stabilized in the $10,150 region, and as we can see, it is still clearly within the bullish pitchfork on the daily chart, suggesting that nothing has changed on the lower timeframe basis:
This chart shows the pointlessness of looking at things at anything more than a daily timeframe. Unless you are a day trader, maintaining a daily/weekly outlook is the best for your sanity and your nerves as this gives the best indication of the overall trend and stops you worrying about any retrospectively tiny movement even though at the time it may seem monumental.
Beware the Bears
Bitcoin’s inability to regain the $10,300 level however has brought many bears out from behind the trees, giving those in long positions something to think about:
if you get the chance to long 8250-8600 and don’t buy there then sorry, but we would have to rally to ATH without you?
p.s. expect 3k calls again in a couple of days pic.twitter.com/sIHJ3iB4tC— Crypto₿irb (@crypto_birb) February 13, 2020
I’m short. pic.twitter.com/YT3EiU9LPN
— Mac ❄️? (@MacnBTC) February 14, 2020
If these predictions bear fruit, then this will present a fantastic opportunity to buy BTC at the mid-9000s for potentially the last time. Don’t forget that this is a bull market now, and as such, dips are for buying.
Alts do the Bitcoin Box Step
Alts, unsurprisingly, are following BTC in looking a little nervy. ETH, which has had an incredible run this week, has been cooling off after its $277 peak on Wednesday. Still, the fact that it has only dropped to $265 is testament to the strength of the market at the moment, although we can expect this to reduce further should BTC drop significantly.
XRP meanwhile is looking incredibly strong, finally catching up to its big cap playmates yesterday, topping out at $0.34 before retracing and bouncing back up to $0.32. The next natural stopping point should it continue is $0.40, and in the current climate there is little to suggest it won’t make it there in short order, and likely beyond.
GNT and ERD on the Watchlist
Other coins that look set for a breakout are GNT and ERD, both of which have risen above local resistance and are now awaiting a pullback before continuation. With most alts, the best place to take final profits on the BTC chart (if you are swing trading) is roughly its place before the big BTC rise in June last year, providing you can back this up with evidence of prior resistance.
Using GNT as an example, we can see that last June there were heavy areas of resistance and support in the ₿0.00001150 before BTC’s big run up:
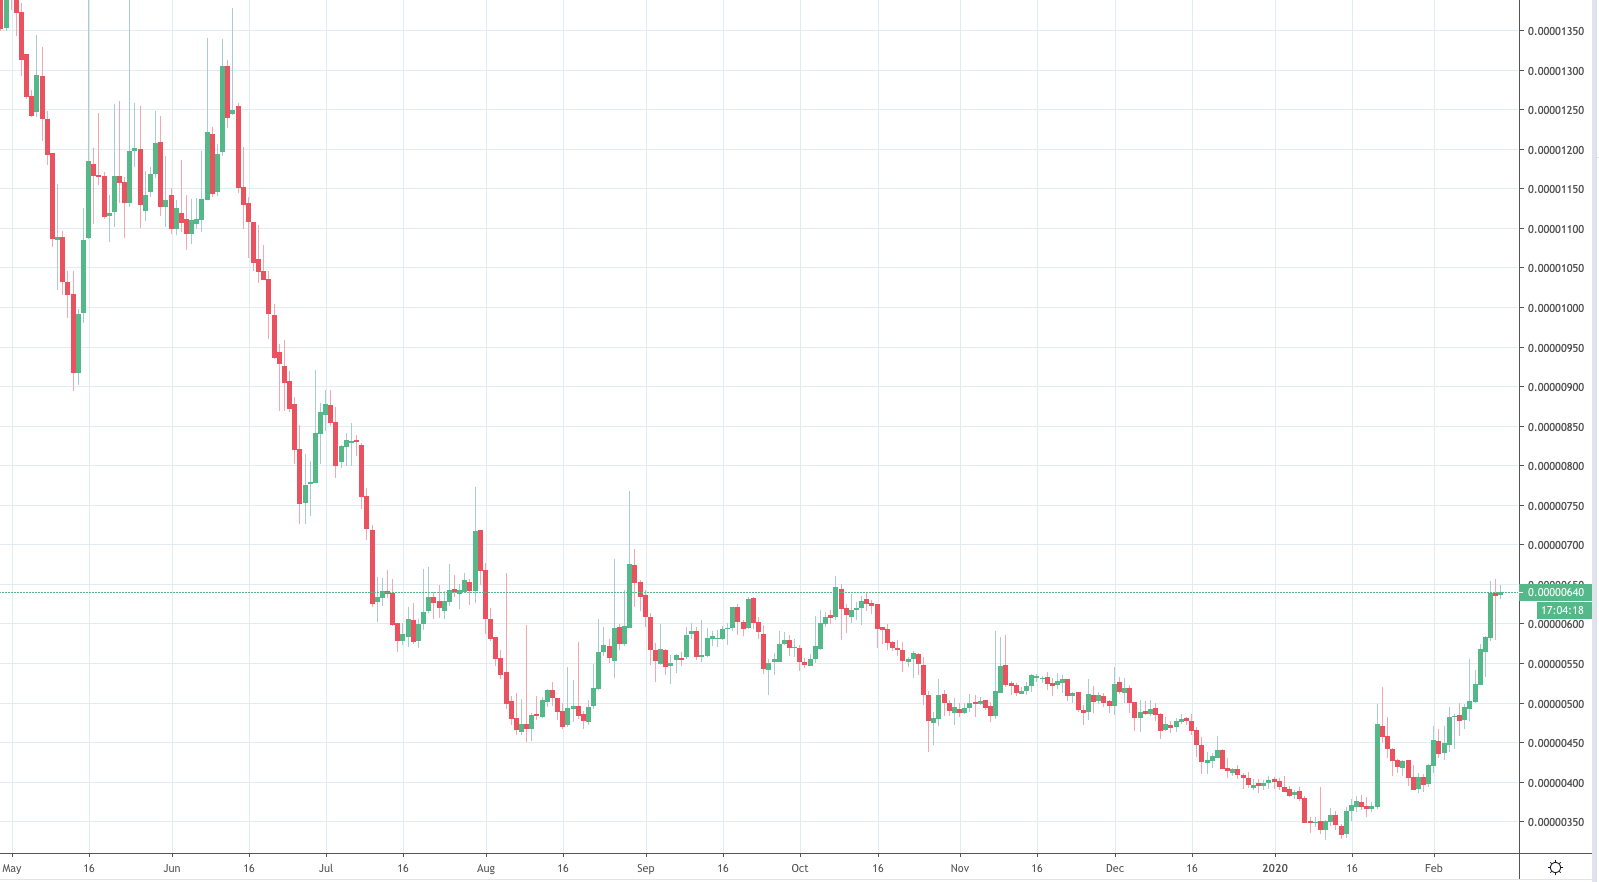
Given the fact that GNT has already run more than 100% off its bottom a month ago, we can expect to meet big resistance again in this area, marking it as an idea place to take profits (of course, there’s no harm leaving a small percentage for a moon bag).
Whichever way you decide to play this potential dip (if it happens), remember that this is the start of a new market cycle, and longing/buying dips should take the place of selling/shorting rallies.