- Bitcoin has started the week green after nine weekly red candles
- Bitcoin faces the resistance band that it has failed to pass all month
- The macro environment suggests that this is just a temporary upward diversion
Bitcoin has finally experienced some upward momentum following a record-setting nine weekly red candles. Having finally started to turn the corner after absorbing two months’ worth of selling, Bitcoin has hit the top of the range it has been stuck in throughout all May, with all eyes on how it deals with its newfound resistance band.
Bitcoin’s Fall From Grace
Bitcoin’s fall from grace from the highs in November 2021 has been nothing short of stupendous, including a vicious nine-week selling streak that began at the end of March:
Finally however there is some green on the board, with all the sellers having been exhausted and market makers seemingly of the belief that, for now, they can’t conclusively break the $30,000 barrier.
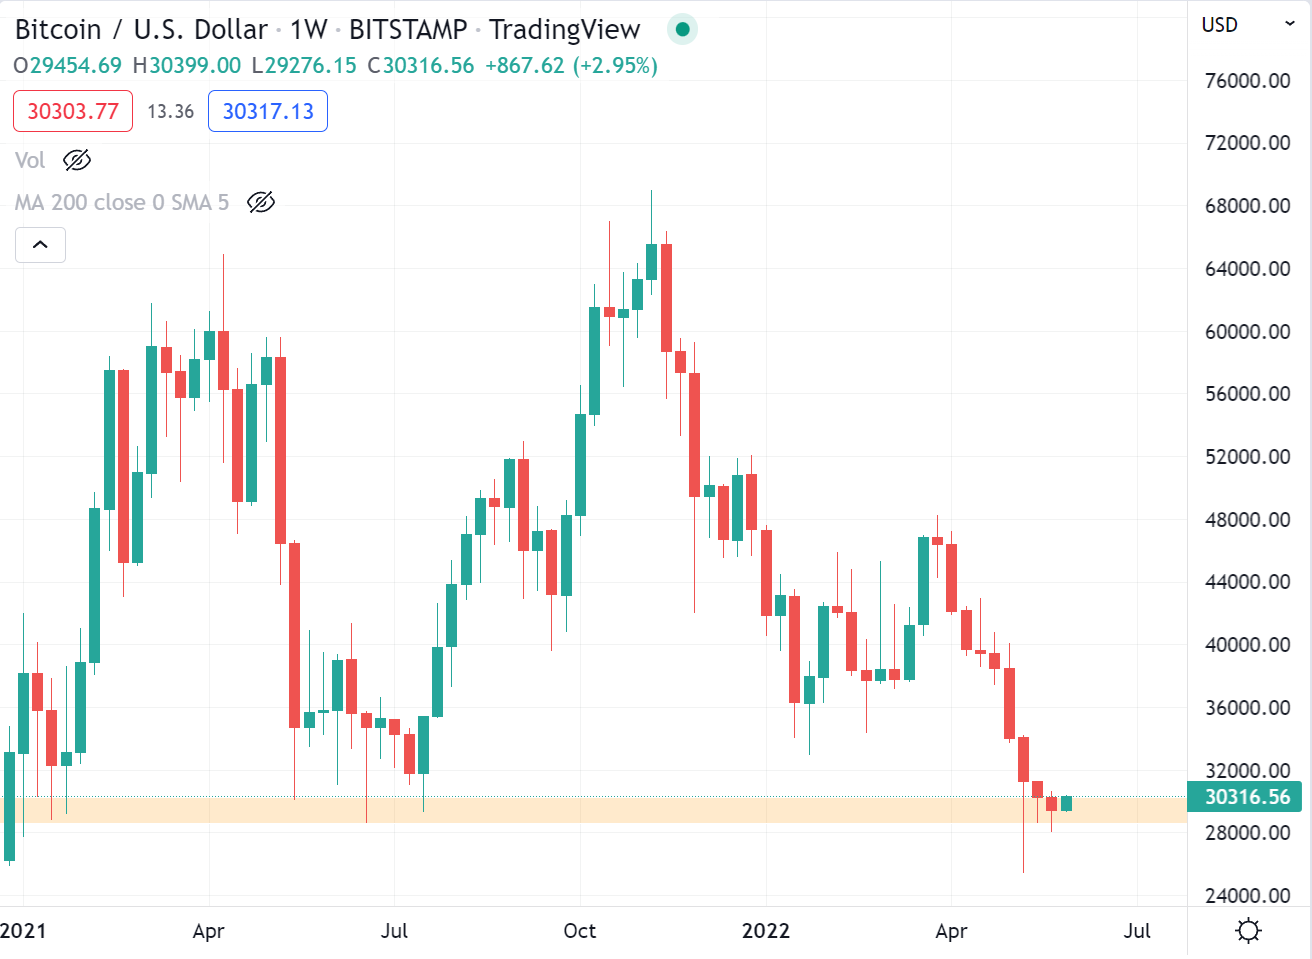
As we can see from the below chart, life in the $28,000-$30,000 range has been brutal, with many being shaken out of their positions in fear of the much-discussed collapse to $24,000, $20,000, and even lower down:

This has led to many being shaken out of their holdings – another reason why just holding your bitcoin and leaving the charts alone is often the best way.
Macro Environment Still Dicey
It seems, then, that Bitcoin is ready to enjoy a relief rally after two months of continuous downward movement, although whether it is the start of a fully fledged recovery or just a small patch of sunlight before a bigger storm is unknown at this point. The wider macro view suggests that risk on assets will suffer throughout the rest of the year until the Federal Reserve eases its quantitative tightening measures, so we will just have to wait and see how Bitcoin deals with that.
What we can tell from the charts is that Bitcoin needs to break and hold above the $30,750 region, which would signal that it has finally broken out of the dreaded May range. From there it faces resistance (on the weekly chart) at $32,000 and $34,700, with its performance here telling us much about its strength in the medium term:

A rejection at the top of the May range may well send Bitcoin right back down to the bottom of the range again, with many sage heads opining that there is only so many times a support can get tapped before it breaks.
Were this to happen, then the mid and low $20,000s could come into play. As always, we don’t know which of these scenarios will play out, so ensure you are prepared for each one.