- Bitcoin has slipped below a key support line dating back to 2017
- The crypto market has endured a continual six-week selloff for the first time since 2014
- The loss of long term trend lines suggests a change in pattern
Bitcoin has slipped below a key weekly trendline as buyers continue to keep away from the market. Bitcoin has now experienced six red weeks in a row, a feat replicated for the first time since August 2014, and it seems that many are waiting for $30,000 or below to get back into the market. The loss of long term trend lines suggests that longer cycles are playing out and that Bitcoin is entering a new phase in its growth.
Long Term Bitcoin Trend Lines Being Broken
The trend line in question has existed for Bitcoin since the $20,000 top in 2017 and has acted as support on three occasions since:
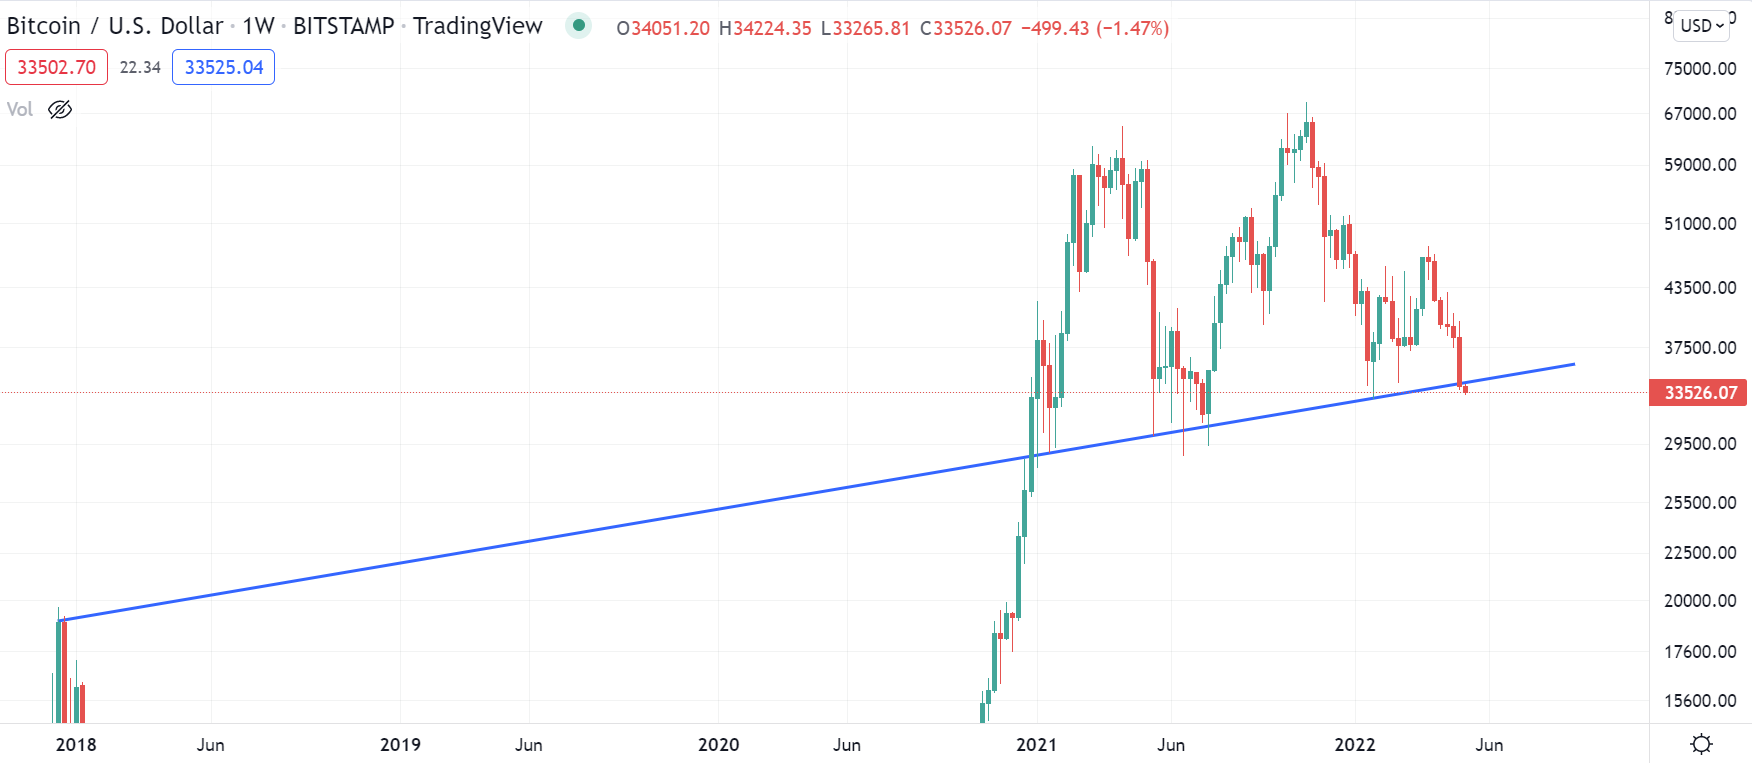
However, Sunday night’s price action has taken Bitcoin below this level of support, and although it has all week to regain it, it is nevertheless symbolic that such a long standing support line has now been breached.
This indicates a shift in medium to long term price action, a shift that can be further evidence with another trend line dating back even further which has now, too, been lost:
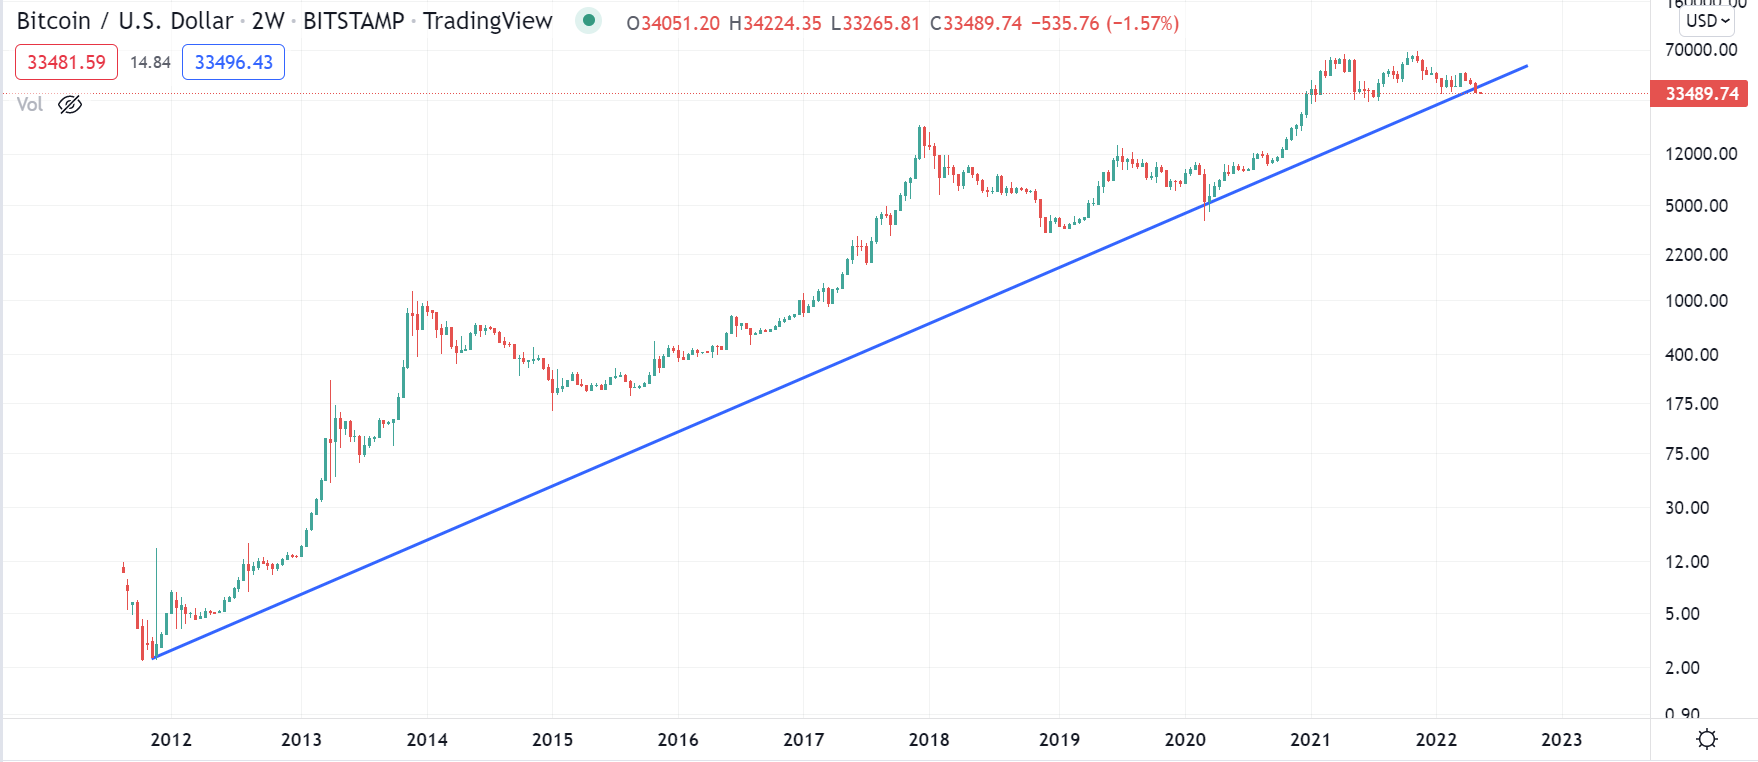
This support line, which dates back to 2012, shows very clearly that Bitcoin’s recent stagnation looks to have brought to an end the continual, crazy growth of the last 10 years and ushered in a new, slower rate of growth.
The breaking of long term trend lines like this aren’t necessarily anything to worry about however. Bitcoin was never going to be able to keep up the rate of growth it has seen since 2012 – it was always going to get to a point where it slowed down and cycles took longer to play out.
This seems to be happening now, and in periods such as what we are experiencing now with stagnation occurring for the last six months or so, although there is one trendline dating back to 2019 that still seems to be relevant today:
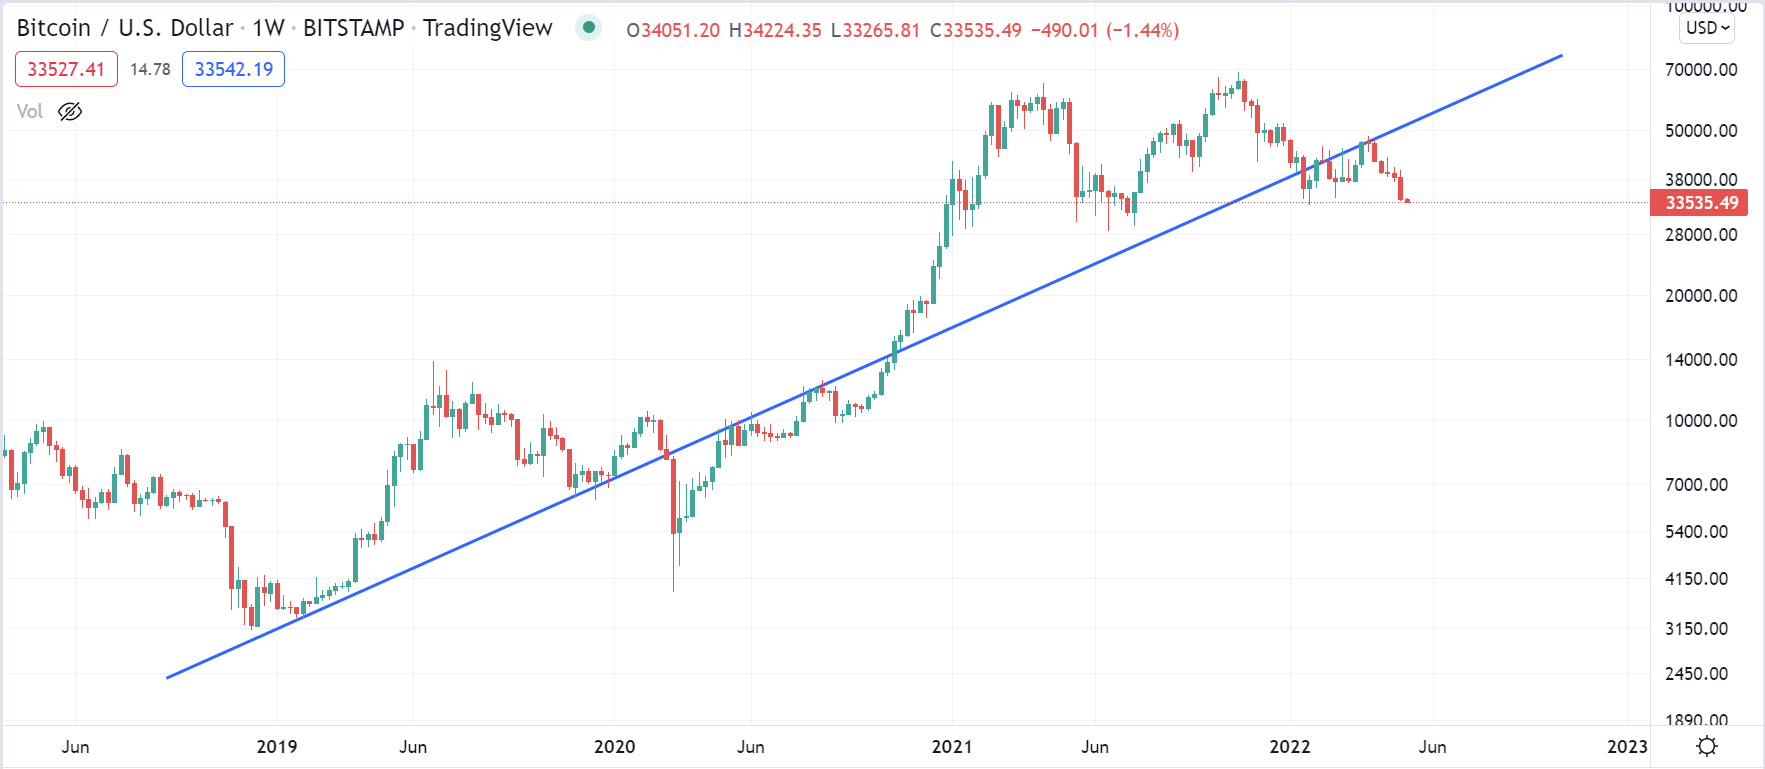
This trendline has acted as both support and resistance ever since it began at the later end of the 2018 bear market, most recently being the catalyst behind Bitcoin’s six-week red spell. It seems then that we can’t officially call it a bull market again until it has once more crossed it for support.
For now, Bitcoin just has to remain above $30,000 for the potential of a bull run again in the short to medium term to take place – trend lines can wait until an actual trend develops once more.