- Bitcoin’s rapid run and recent correction has some worried that the 2021 bull run is over
- There are striking parallels between the last Bitcoin broke an all-time high in 2017 and what we have seen
- This correction is firmly in line with what we saw in 2017 before Bitcoin went parabolic
Bitcoin’s rapid rise to $42,000 and its $10,500 correction has got many worried that the Bitcoin bull run is over, that what we’ve just seen is a prelude to a larger correction down to $20,000 or below. While we can certainly say that Bitcoin grew too fast too soon towards the back end of last year, there are striking similarities between what happened the last time Bitcoin broke through its all-time high in 2017 in the lead up to that bull run and what we have seen in recent weeks that suggest the exact opposite is going to happen.
Almost Exact Parallels to 2017
Anyone looking at the Bitcoin weekly chart since September is right to think that Bitcoin is overextended, or certainly was until the recent correction. However, thinking that it will drop back to where the run started back in September ignores where we are in the market cycle. If this was the end of the bull run then you could certainly argue that case, but this is just the beginning, and if we look back to this stage of the last bull market we can see some striking parallels.
First, let’s take a look at what happened when Bitcoin broke its prior high in 2017:
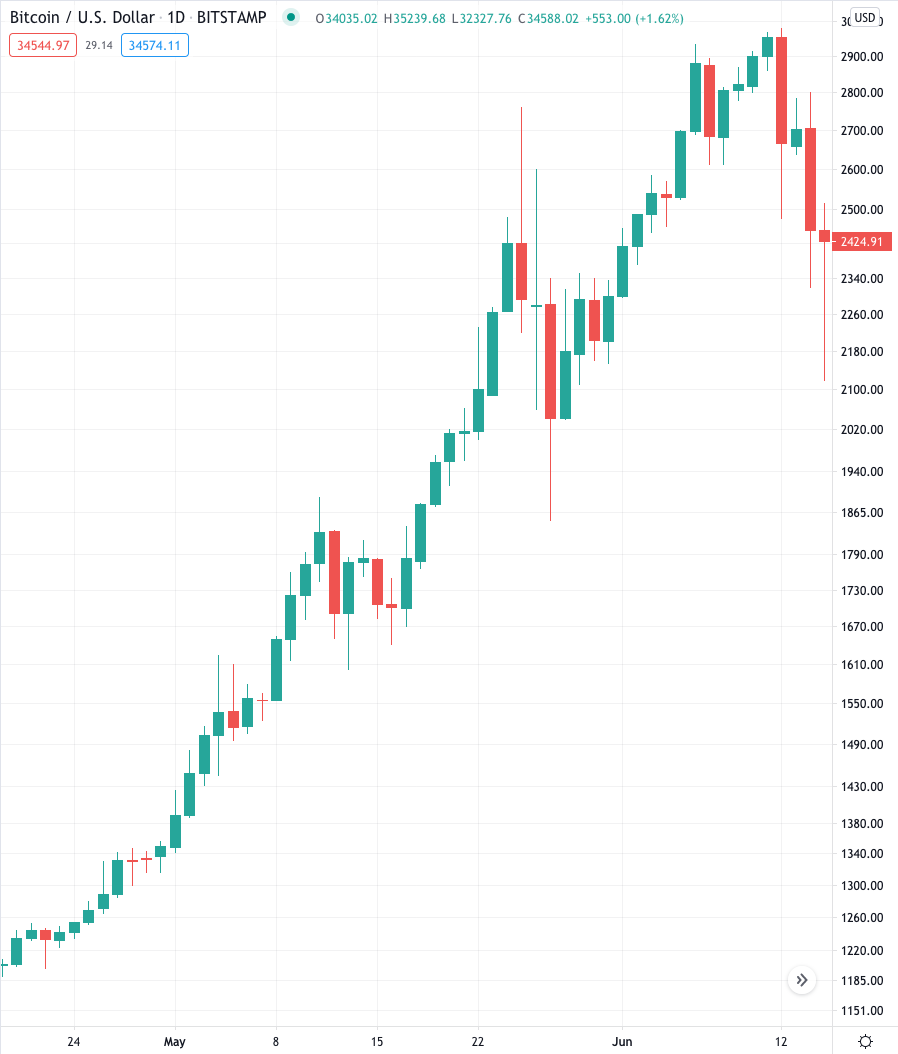
As we can see, iBitcoin breached its previous high of $1,180 in April and went on to hit $2,980 the month after, representing a quickfire 150% increase. Following this jump it corrected back down to $2,120, a 28% drop.
Fast forward to 2020/21 and what do we see:

Bitcoin crossed its previous high of $20,000 on December 16 and famously raced to $42,000 within three weeks, a 110% gain. This is 40% short of the 2017 gain, but with Bitcoin being a much pricier asset this is to be expected. And what have we seen since? A pullback to $30,280, representing a 28% correction – exactly the same as we saw after the 2017 rise. The parallel is striking, right down to the two pauses along the way in both instances.
Bitcoin Ready For Next Leg?
Now let’s remind ourselves what happened in 2017 after that first pullback. Bitcoin saw a fakout and a further dump to $1,840 which prompted Forbes to ask “Is This The Bottom?” Indeed it was, as Bitcoin went on a tear during the final part of its bull run, putting on 90% in five months to hit all time highs in December:

Taking a birds-eye view of the Bitcoin chart we can see exactly how the two scenarios compare:
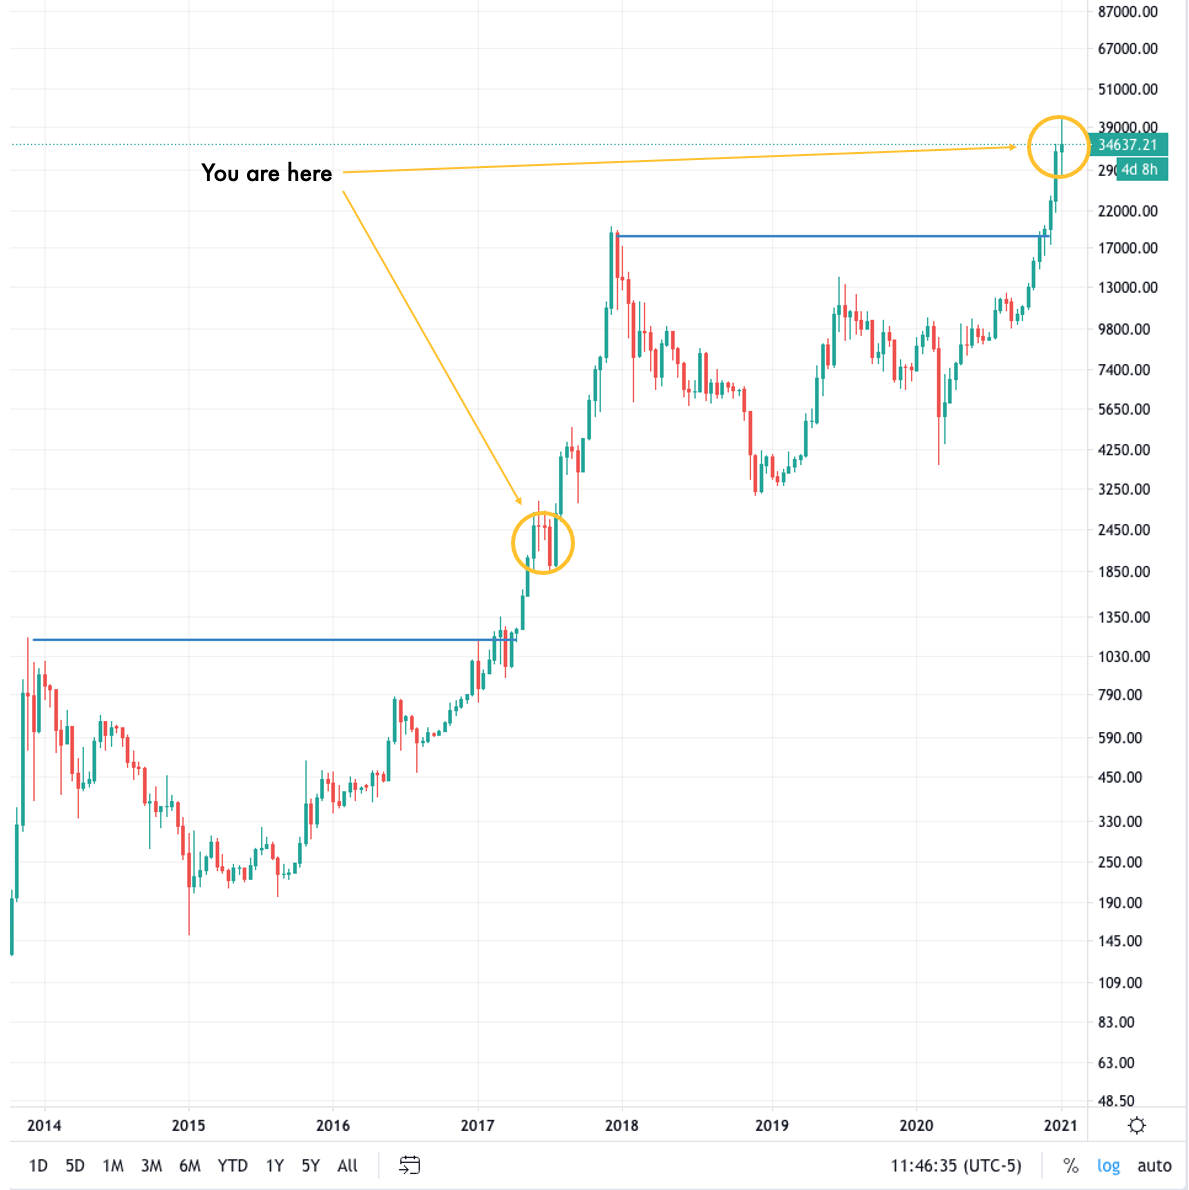
We can clearly see that the recent pullback is happening right at the start of the cycle, meaning that, unless Bitcoin is going to break with history and the concept of market cycles, the idea that Bitcoin is going to retrace its entire four-month move is about as likely as XRP not being a security.
Jokes.