- The Bitcoin cloud indicator is at a crucial point
- For the first time in nine months, the 21-day EMA and 200-day EMA have intersected
- It’s not yet clear if this is confirmation of a breakout or if it will reject
A long term Bitcoin indicator is at a key level following the recent rally, a level which will give us a clear indication of where we are in the recovery process. The Bitcoin cloud indicator, which indicates the level to which the Bitcoin price is in a bullish or bearish timeframe, is at a point heavily reminiscent of April 19, 2019 when Bitcoin rallied from $3,500 to $14,000, although we need to see a crossover and confirmation before we can be sure of a reversal.
Bitcoin Cloud Indicator EMAs Intersecting
We first covered the Bitcoin cloud indicator in April last year, showing how it is made up of a green line (21-day EMA) and a red line (200-day EMA), with the space between them colored in order to show the sentiment of the market price-wise:
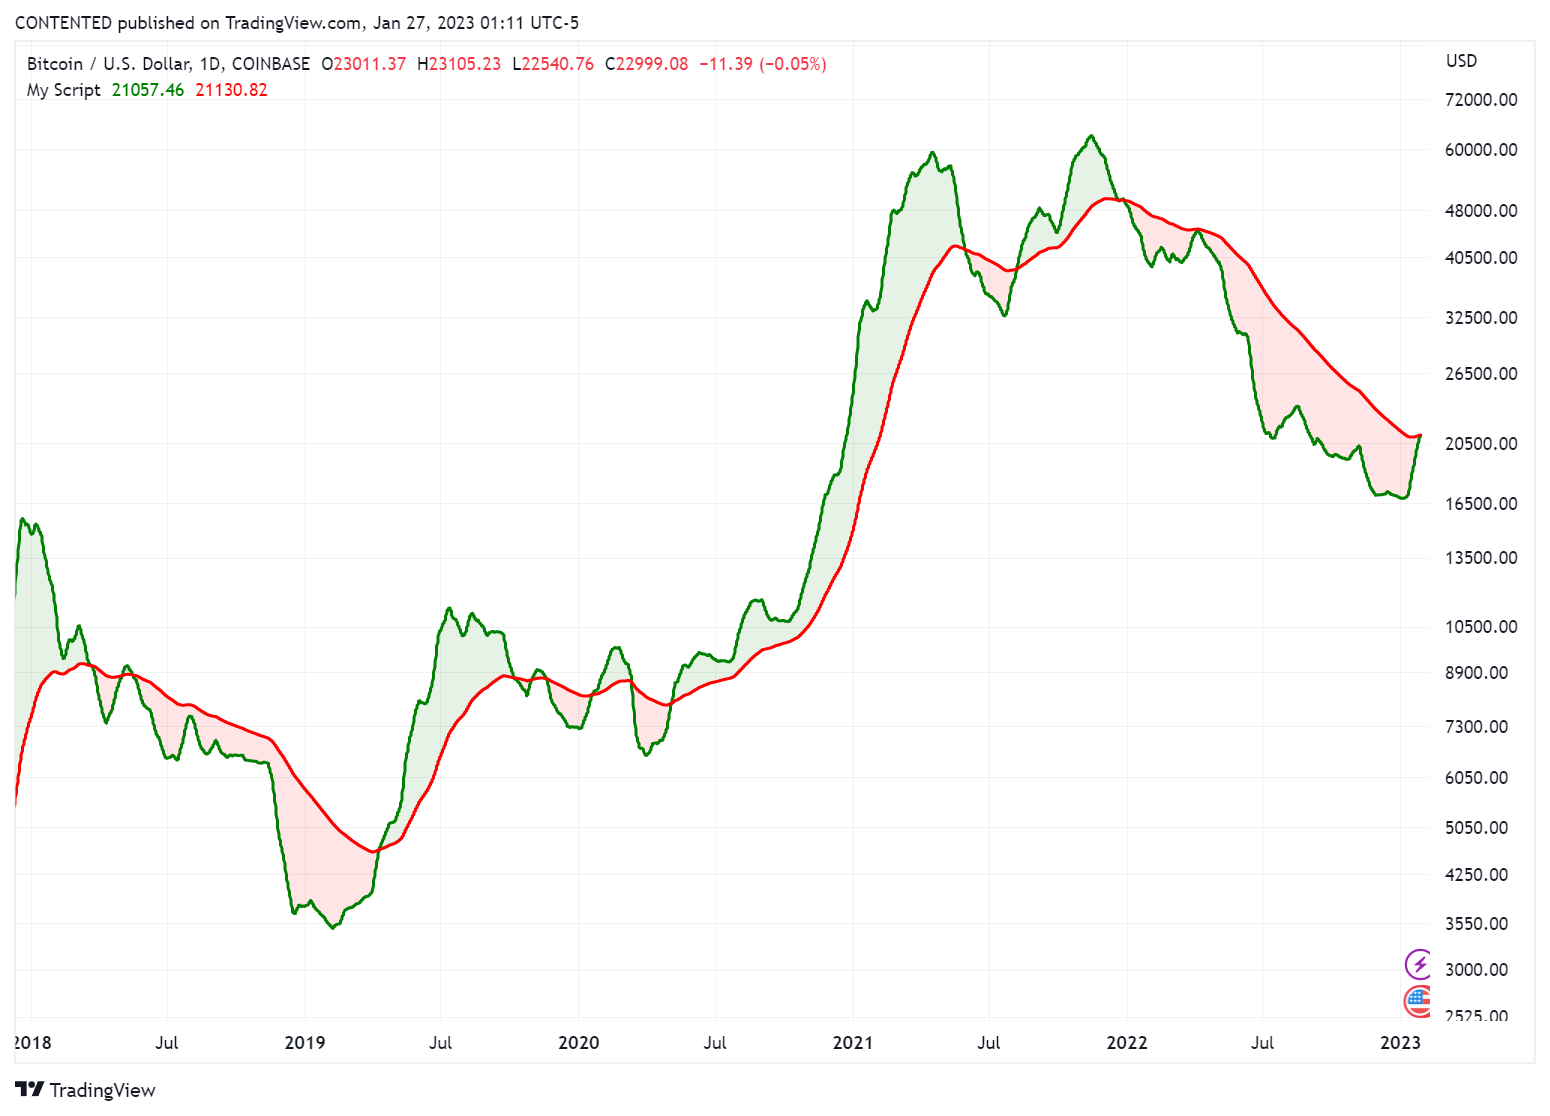
At the time, Bitcoin had just been rejected from an attempt to break above the 200-day EMA, which led us to conclude that it would not be wise to take new positions as a downtrend was imminent. This has proved to be the case, with the Bitcoin price falling to $15,500 in late November.
We returned to the chart in August to say that it looked as though a bottom construction was forming and, barring any black swan events, a period of accumulation was taking place. Of course, FTX saw to that, and we had another leg down. Thanks Sam.
Accumulation or Fakeout?
Now, however, things are looking up – literally. The near $10,000 jump since the November bottom has led to the two lines intersecting for the first time in nine months, and putting Bitcoin in a very interesting position. We could be in the same position as we were in April 2019, where a crossover took place and the recovery from the November 2018 bottom (in terms of price) continued through to $14,000.
Alternatively, we could be about to experience something like November 2019 or January 2020, where the crossover is a fakeout and price drops back down again to somewhere near the old lows, or further.
Of course, only time will tell, but the fact that the price has stalled here after such a mammoth run is very interesting, and the next couple of weekly closes will be key to determining direction.