- Bitcoin has just cemented itself inside a four-year rising wedge
- The wedge began with the 2017 top and has just been confirmed
- Rising wedges are bearish patterns that usually precipitate a market reversal
Bitcoin has this week cemented itself inside a rising wedge that has been building ever since the 2017 top. The recent support at $46,000 has acted as the third touch point on the baseline needed to confirm that a rising wedge is in play, and with rising wedges being typically bearish patterns we can assume that it is more likely that the end of the bull run will be over by mid-2022.
Recent Drops Have Confirmed Rising Wedge
Bitcoin’s rising wedge has its roots in the $20,000 top in 2017, with the series of local tops in May 2021 acting as confirmation of a line of resistance. The March 2020 crash wasn’t significant of anything more than a typical correction a the time, but the past few weeks have seen Bitcoin drop to $42,000 and $46,000, two points that have acted as the two further touch points needed to confirm a rising wedge:
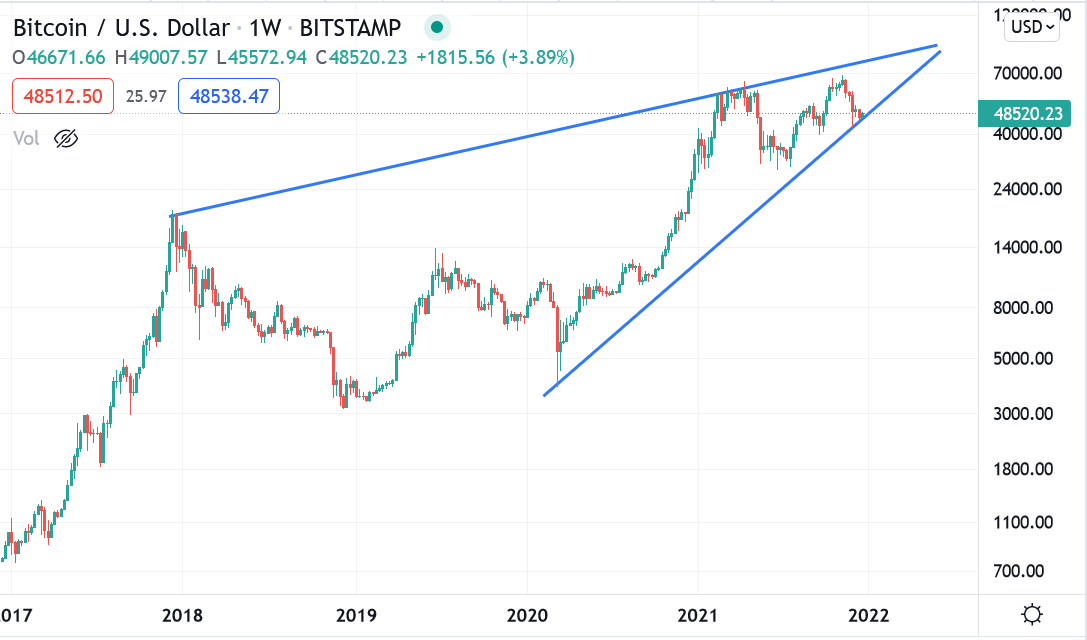
Rising wedges are typically bearish and usually determine a pattern reversal after bullish price action or continuation of a downtrend. It goes without saying then that Bitcoin is in a precarious position with regards to this wedge – if $46,000 doesn’t hold in the next few weeks then the Bitcoin has lost the crucial trendline and we can start to consider the possibility of a longer term correction.
On the flip side, if Bitcoin bounces from here we can be hopeful of a price rise towards the apex of $93,000 in June 2022, at which point we should make plans for a reversal.
Longer Bear Market Could be Coming
The only caveat to this scenario is the fact that the wedge takes into account two bull markets and a bear market rather than just one continuous spell of upwards price action. Rising wedges don’t usually take into account an existing price reversal, but we must remember that the chart above is logarithmic rather than regular. As far as the logarithmic chart is concerned Bitcoin hasn’t entered a proper bear market since 2017.
Indeed, even if we assume that the March 2020 crash was a black swan that should be discounted, we can see that the same scenario applies, just with the apex being further out:
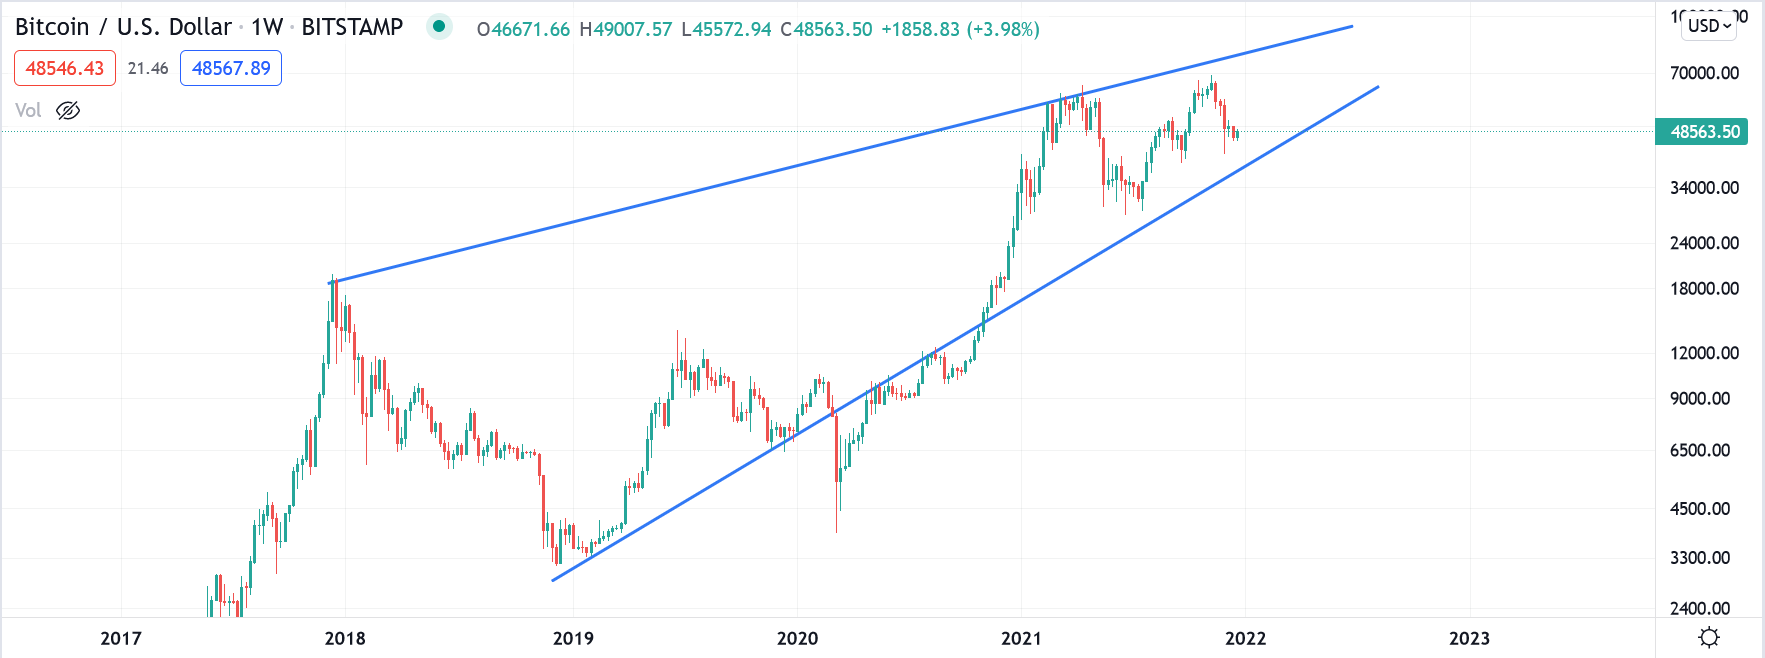
Of course, it’s obvious that Bitcoin is not going to be in a bull market forever, but this long term rising wedge suggests that the next crash could result in a much longer bear market than anyone anticipated given how long the rising wedge has been building for.