- Bear markets are long and brutal, but with crypto they do seem to have a pattern
- The prior two bear markets have ended in very similar ways
- What can we learn from past bear markets and how will it apply to the current one?
There are plenty of people in the space who still think that the crypto bear market is already over and that a recovery is underway. They may, of course, turn out to be right, but all the signs, both in a macro sense and in a market sense, suggest the opposite is true. Assuming we are at the start of a crypto bear market, can we tell from the charts when the time has come to start dreaming again? Let’s find out.
Bear Market Patterns Help Guide Future
While every crypto bull run has been different from the last for a variety of reasons, the two bear markets we have seen have typically followed a similar pattern. We’ll present them here and see if you can spot the similarities.
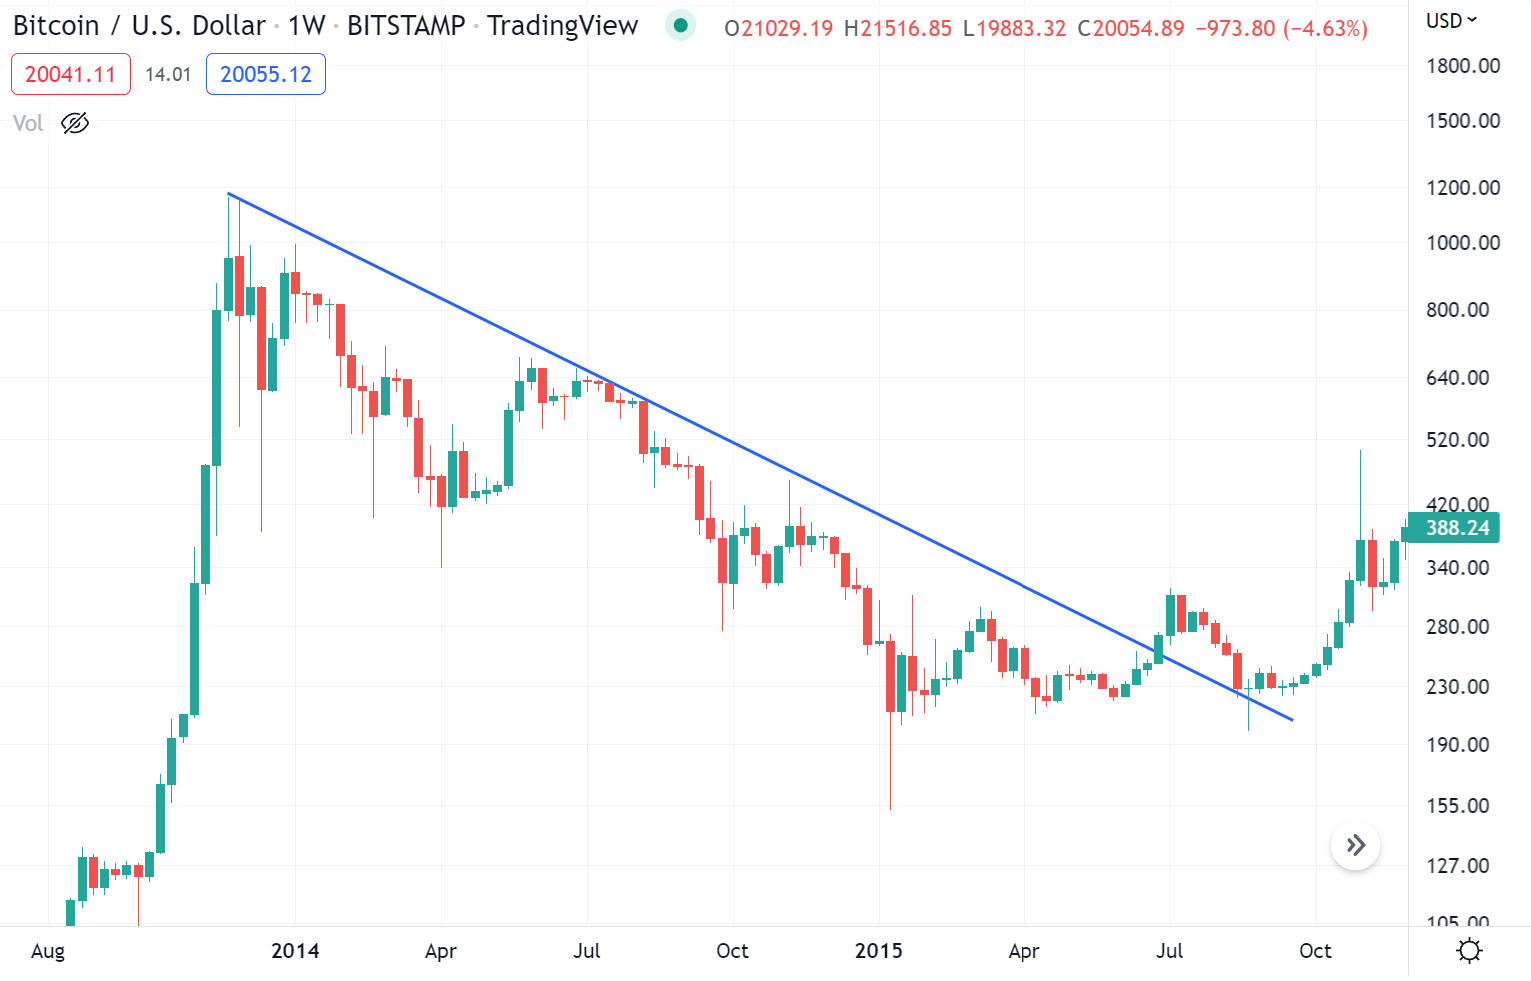
First the 2014/15 bear market:
And now the 2018/19 bear market:
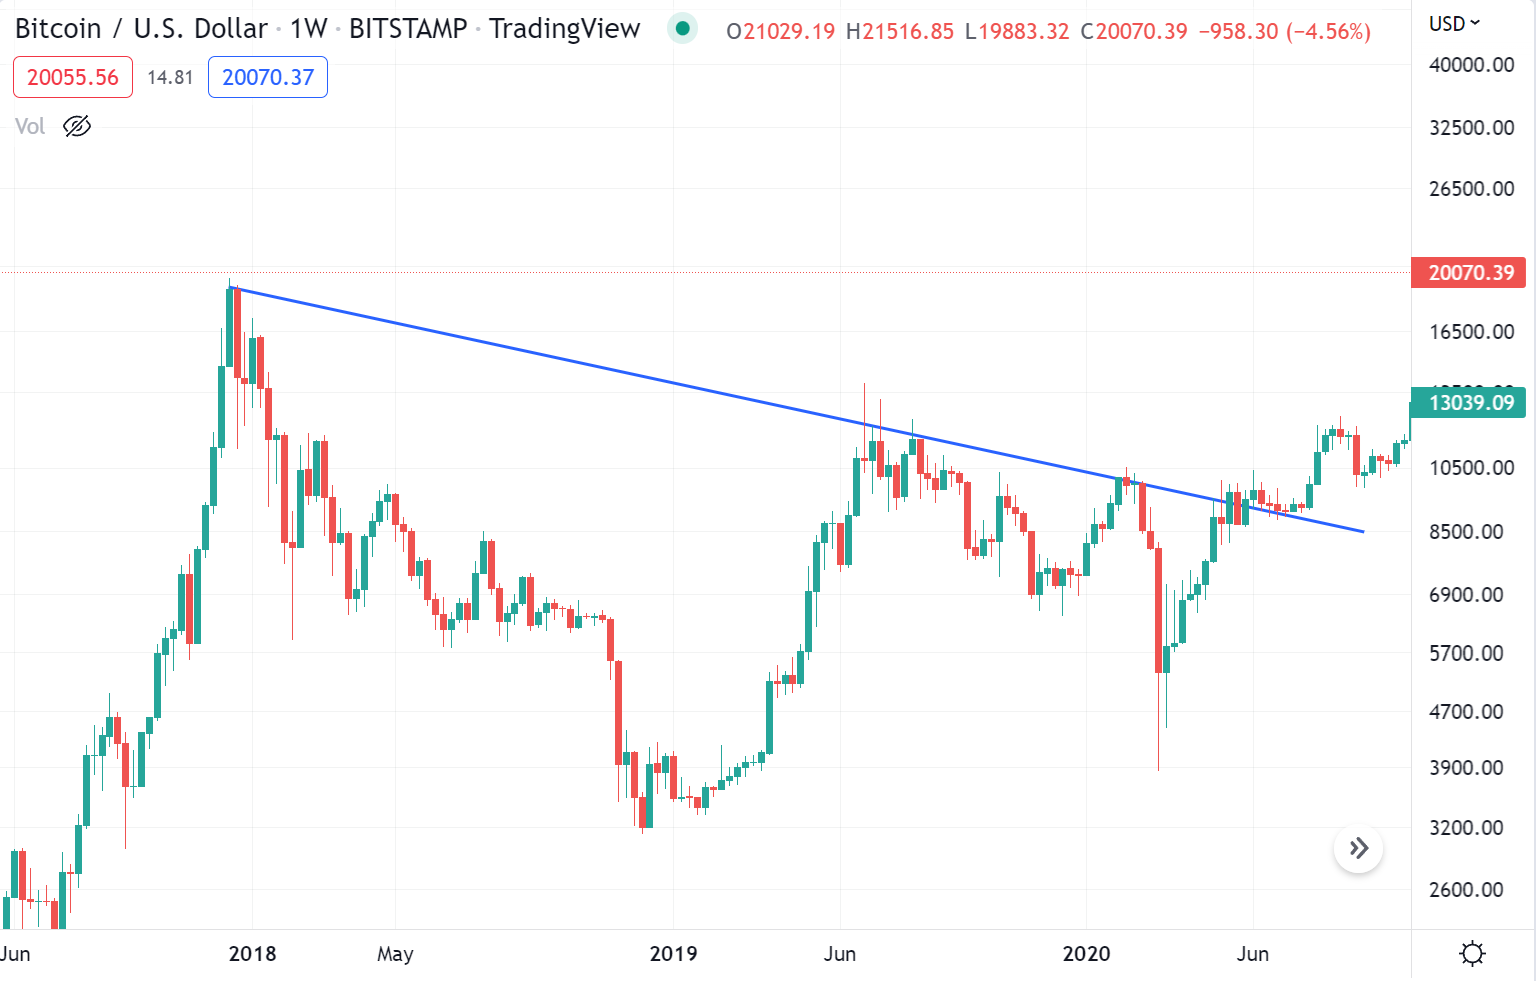
We can clearly observe the same pattern when it comes to the next cycle starting – price finally breaks above the trendline that has been acting as resistance since the prior peak, skirts along it, and then finally breaks through. This kicks off the next cycle proper.
It’s worth nothing that this trendline does not dictate the moment the bear market is over, more that the new cycle has officially begun. In between there is a kind of no man’s land, typically between the final flush (e.g. January 2015 and March 2020) and the breaking of the trendline where no one is sure of where the market really lies.
How Might 2022/23 Look?
So how might this play out in the current bear market? Let’s see how the chart is shaping up:
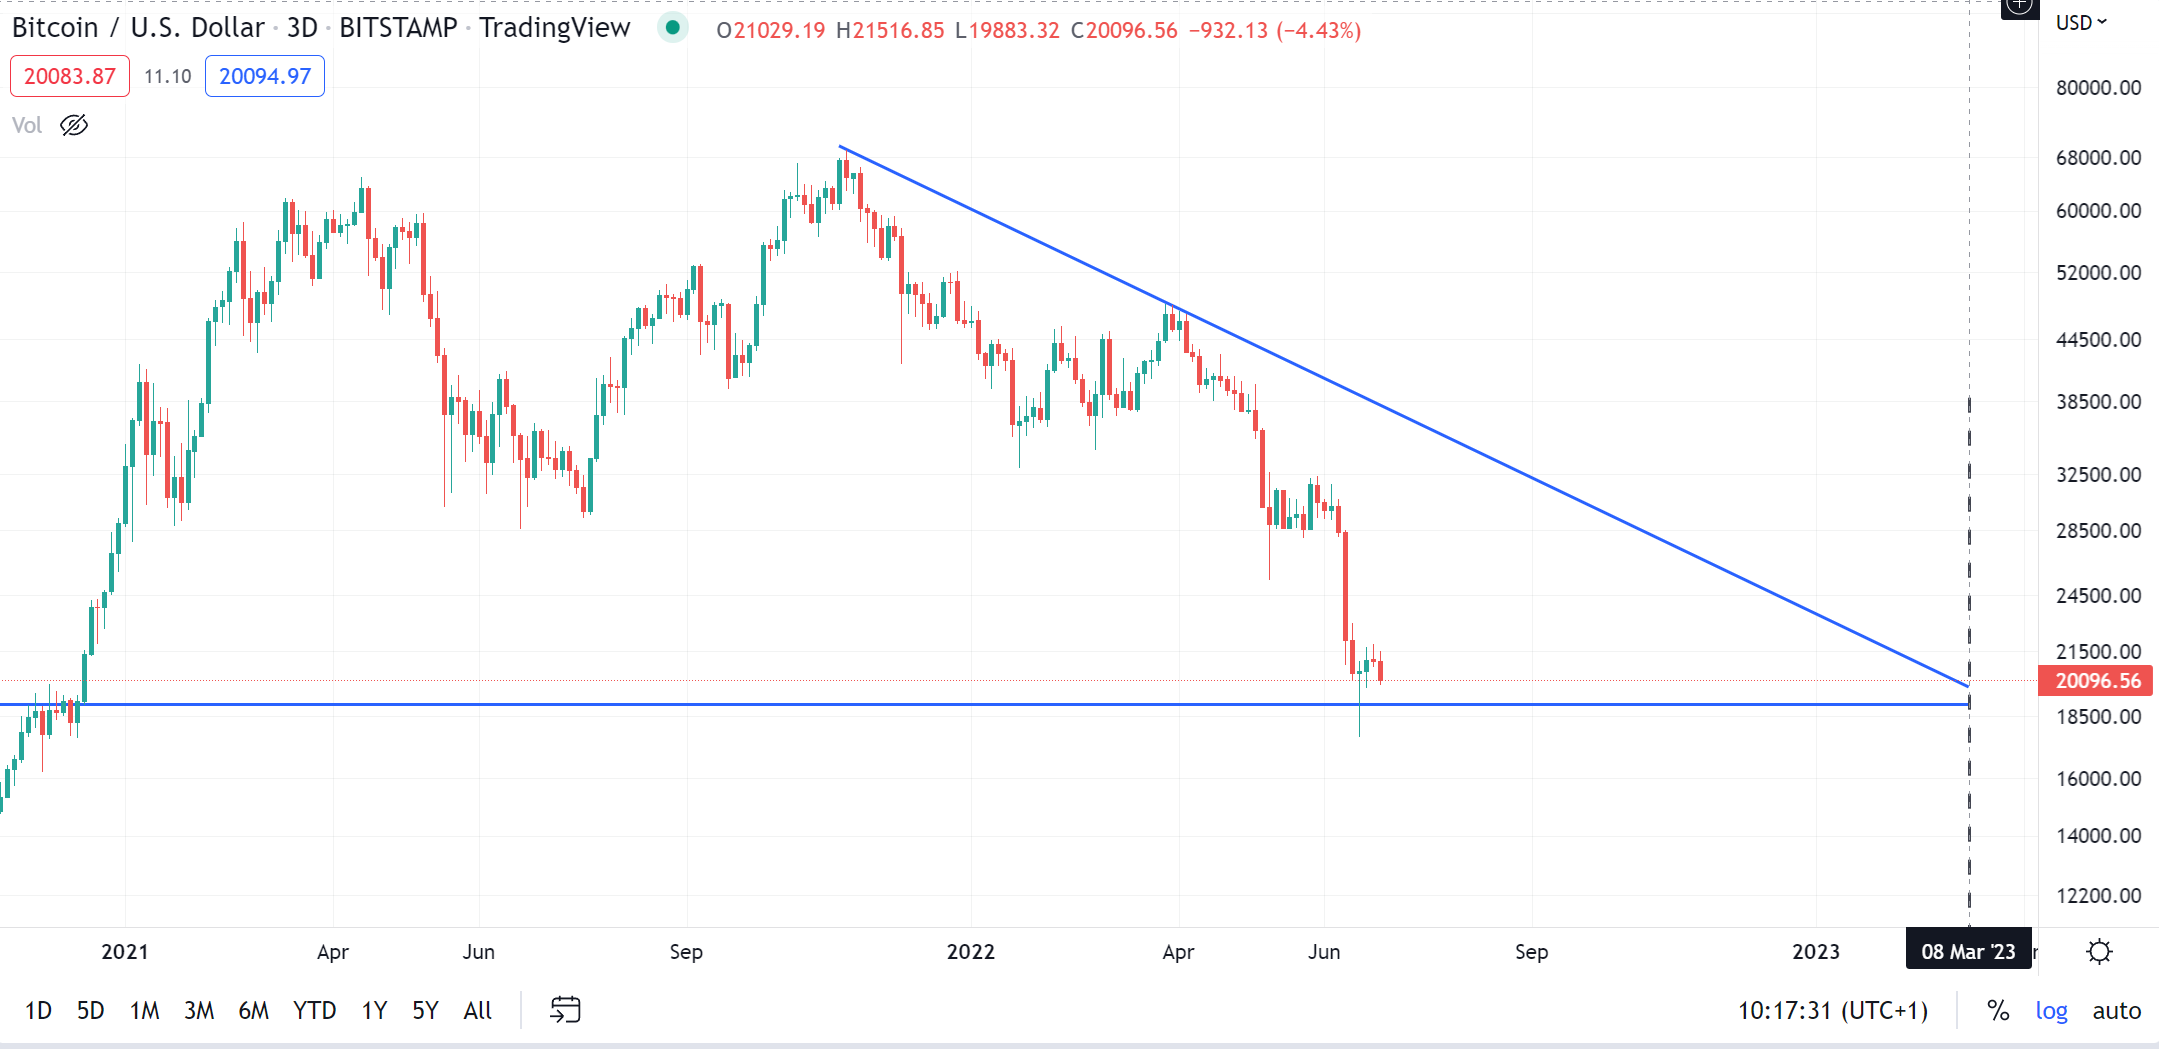
Assuming that $20,000 remains the floor for the majority of the bear market, we can see that the trendline is already in evidence, helped by the failed rebound to $45,000 in March/April.
Assuming we last the full stretch, this leads to the theory that the bear market will end around March 2023, which would fit nicely with the theory that the next Bitcoin halving in May 2024 will act as a natural catalyst for the new cycle. This would replicate what has happened in the past, where the market has about a year’s worth of recovery and acceleration before the halving kicks off the final flourish.
So how can we envisage the bear market playing out? Again, assuming that $20,000 remains the floor, and assuming we have the end-of-market flush, something like this may end up playing out:
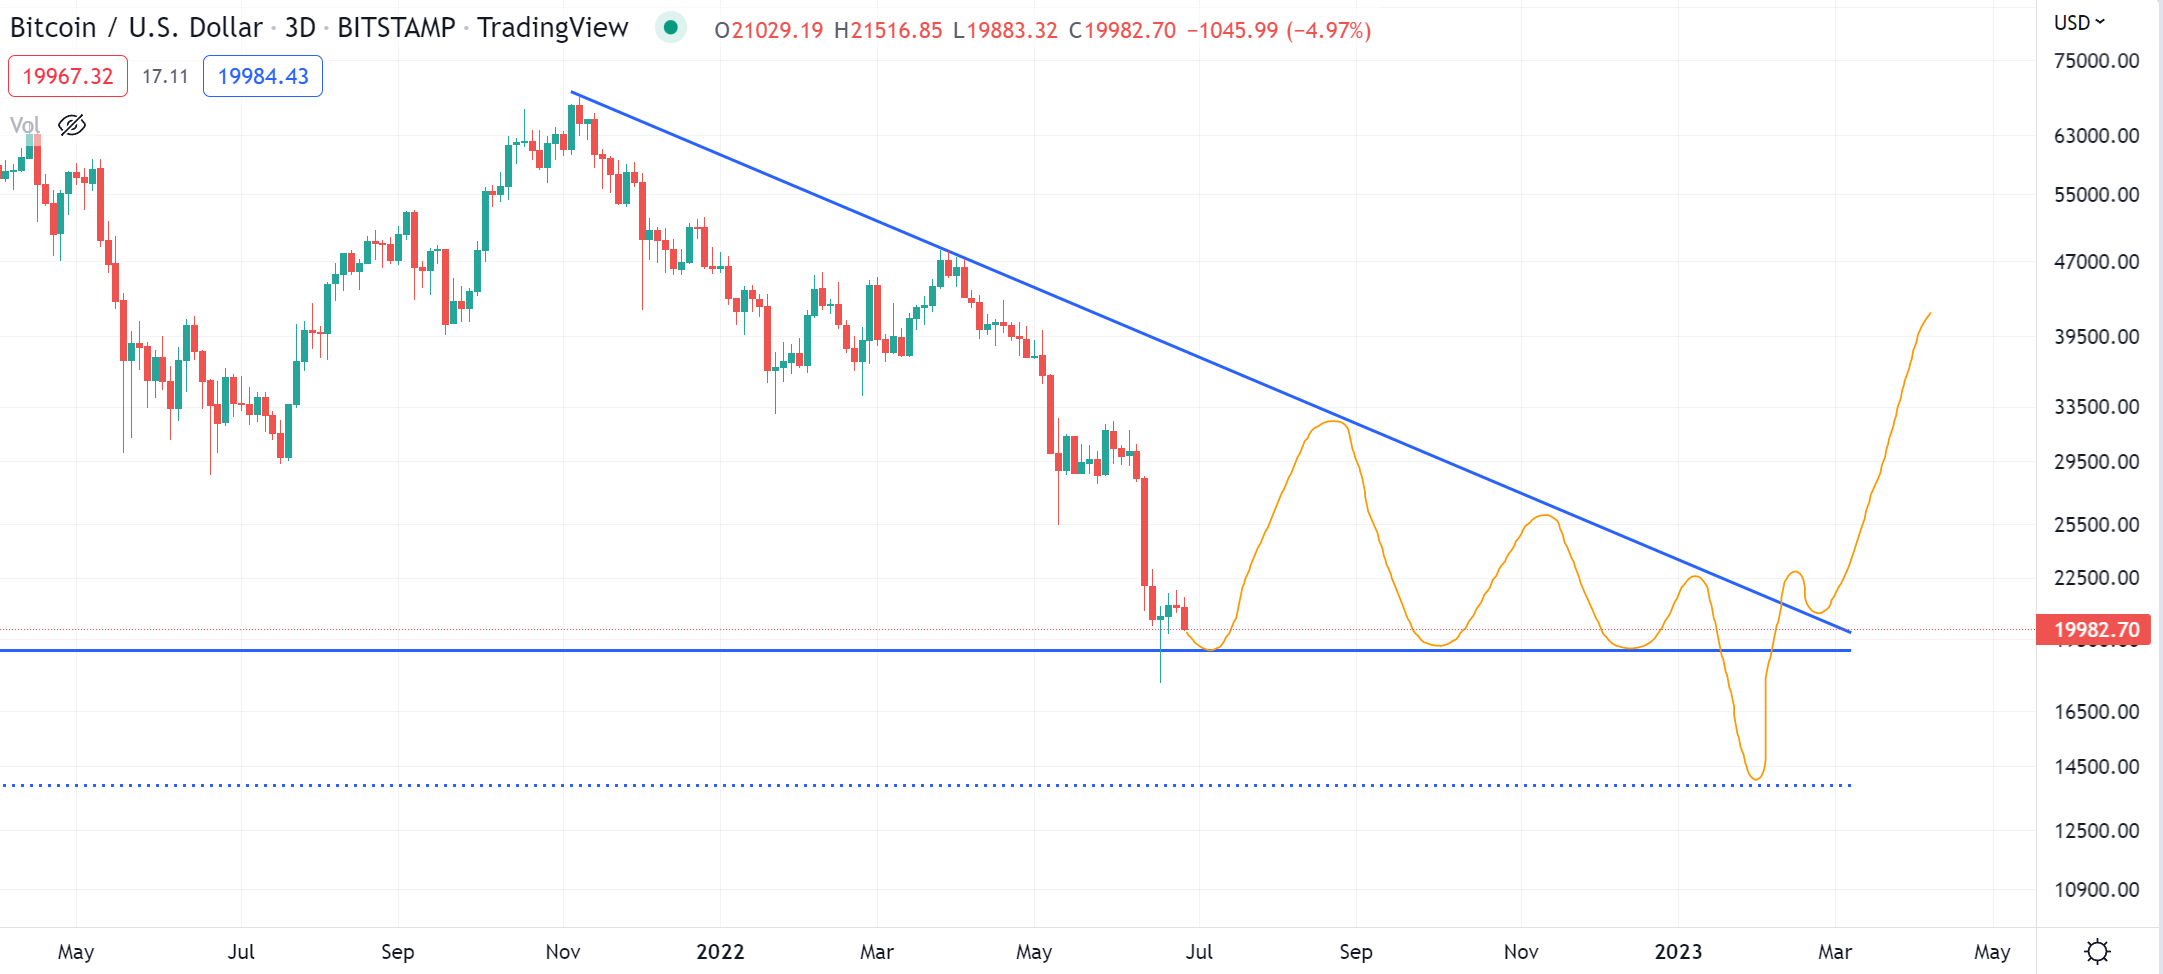
As we discussed this week, $14,000 presents a strong level of interest on a monthly timeframe, so a final flush to this level would be fitting, especially because this would take Bitcoin to a 79.7% peak to trough reversion, bang in line with a typical bear market drawdown.
A pattern such as this would fit in with the cycles of the past and would set us up for a post-halving bull market that should see Bitcoin hit $100,000 in 2025/26.
Until then, just keep your powder dry folks.