- The Bitcoin cloud indicator is an easy way to judge the state of the Bitcoin market
- The indicator is made up of two EMAs and a cloud perspective to clearly show what’s happening with Bitcoin
- The Bitcoin cloud indicator can be used to predict when a bull run is starting
There are several charts and indicators we can use to gauge the state of a market, but one little known one has been proficient in highlighting when a Bitcoin market cycle is beginning. It is a simple combination of two exponential moving averages (EMAs) represented in a cloud format that offers a clear visual representation of when is a good time to get in and out of the crypto markets.
Simple and Easy to Follow
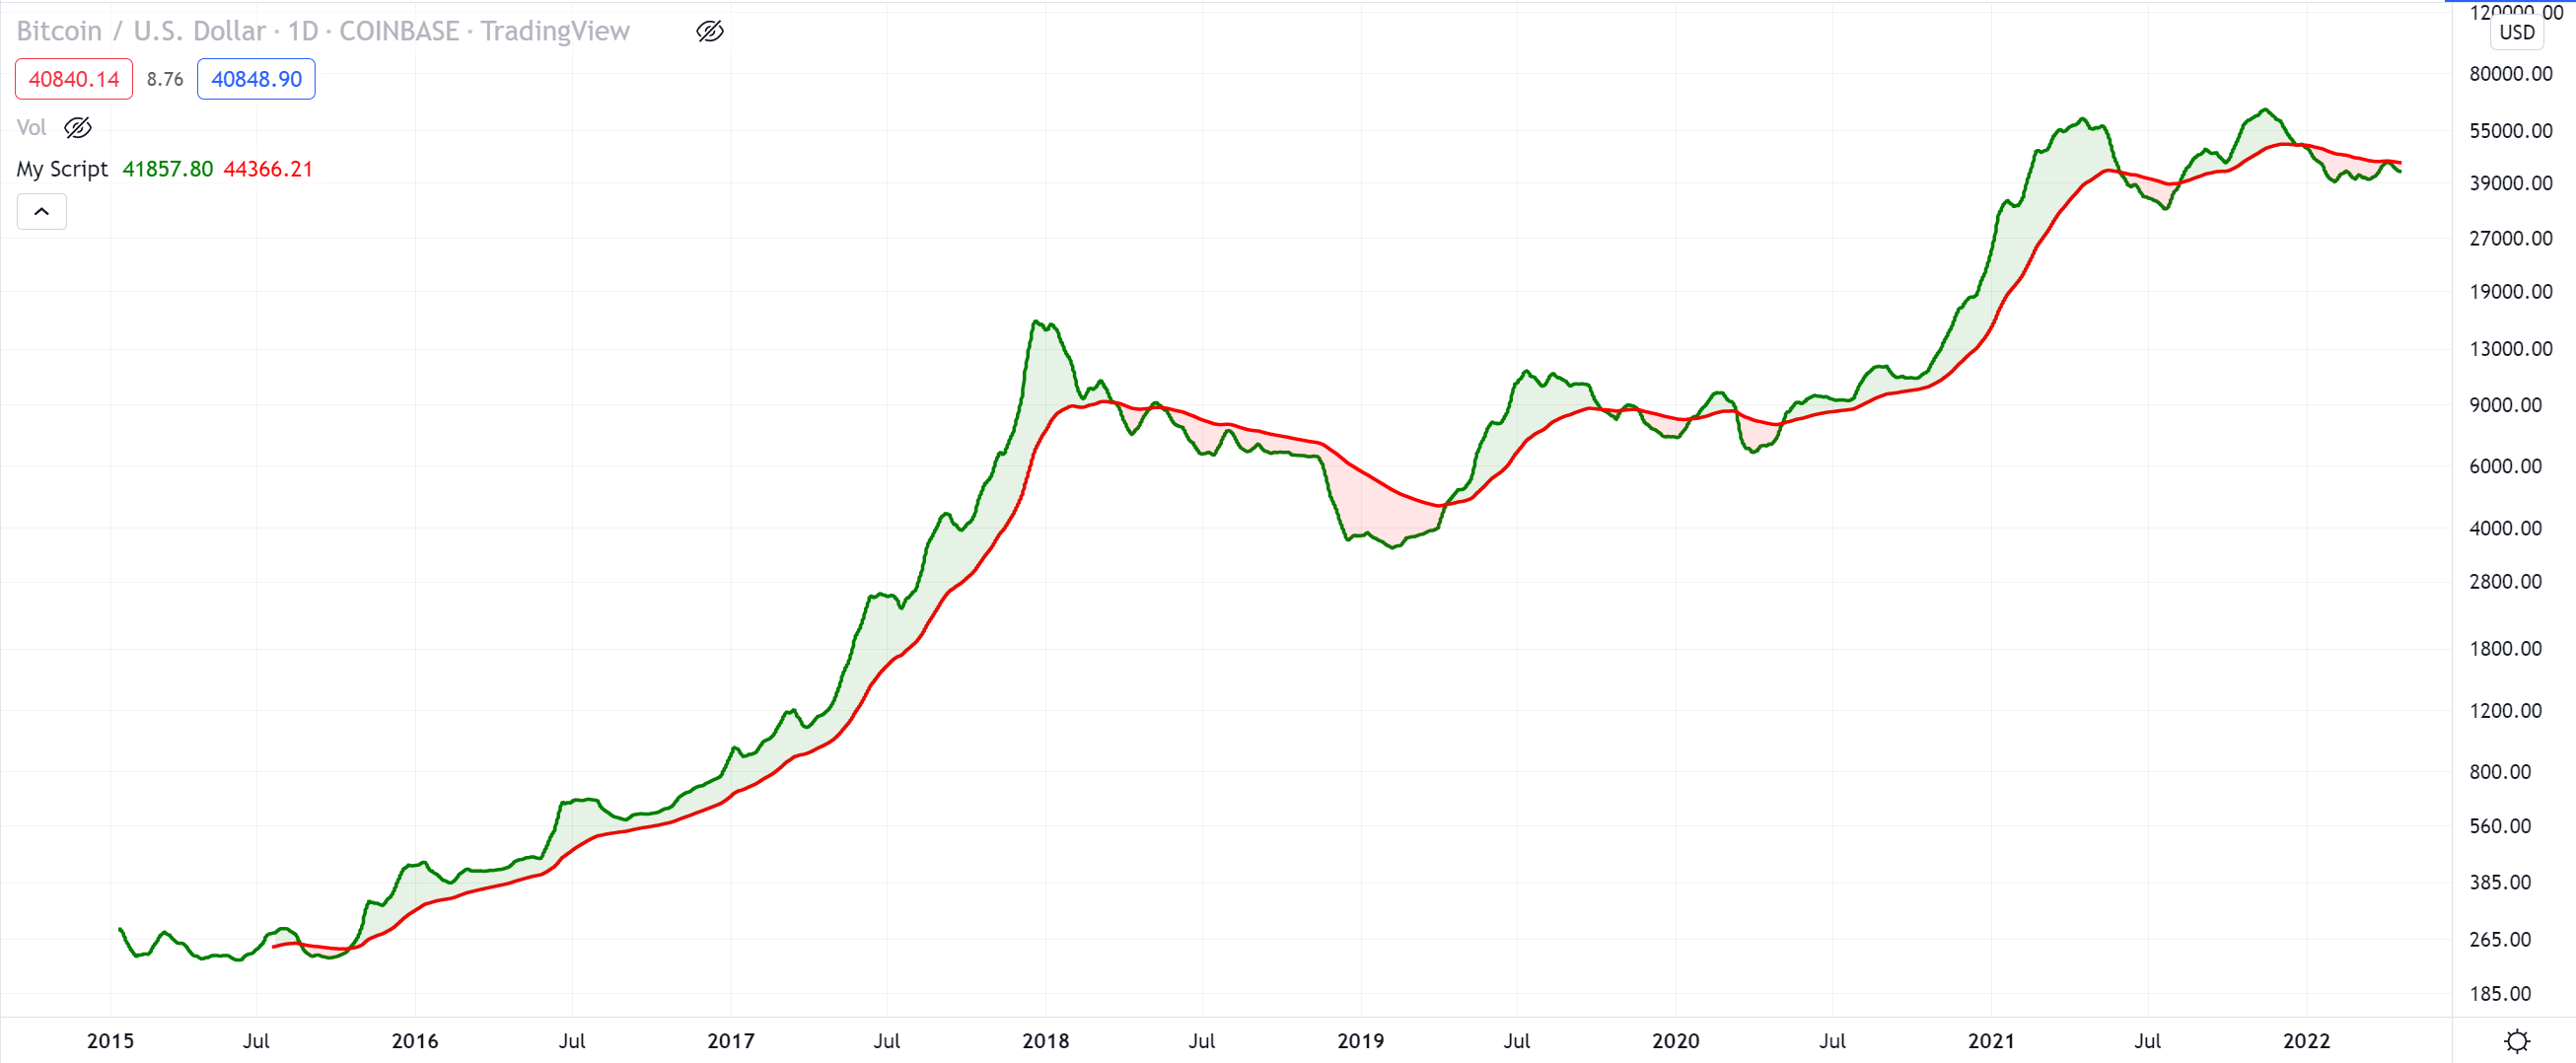
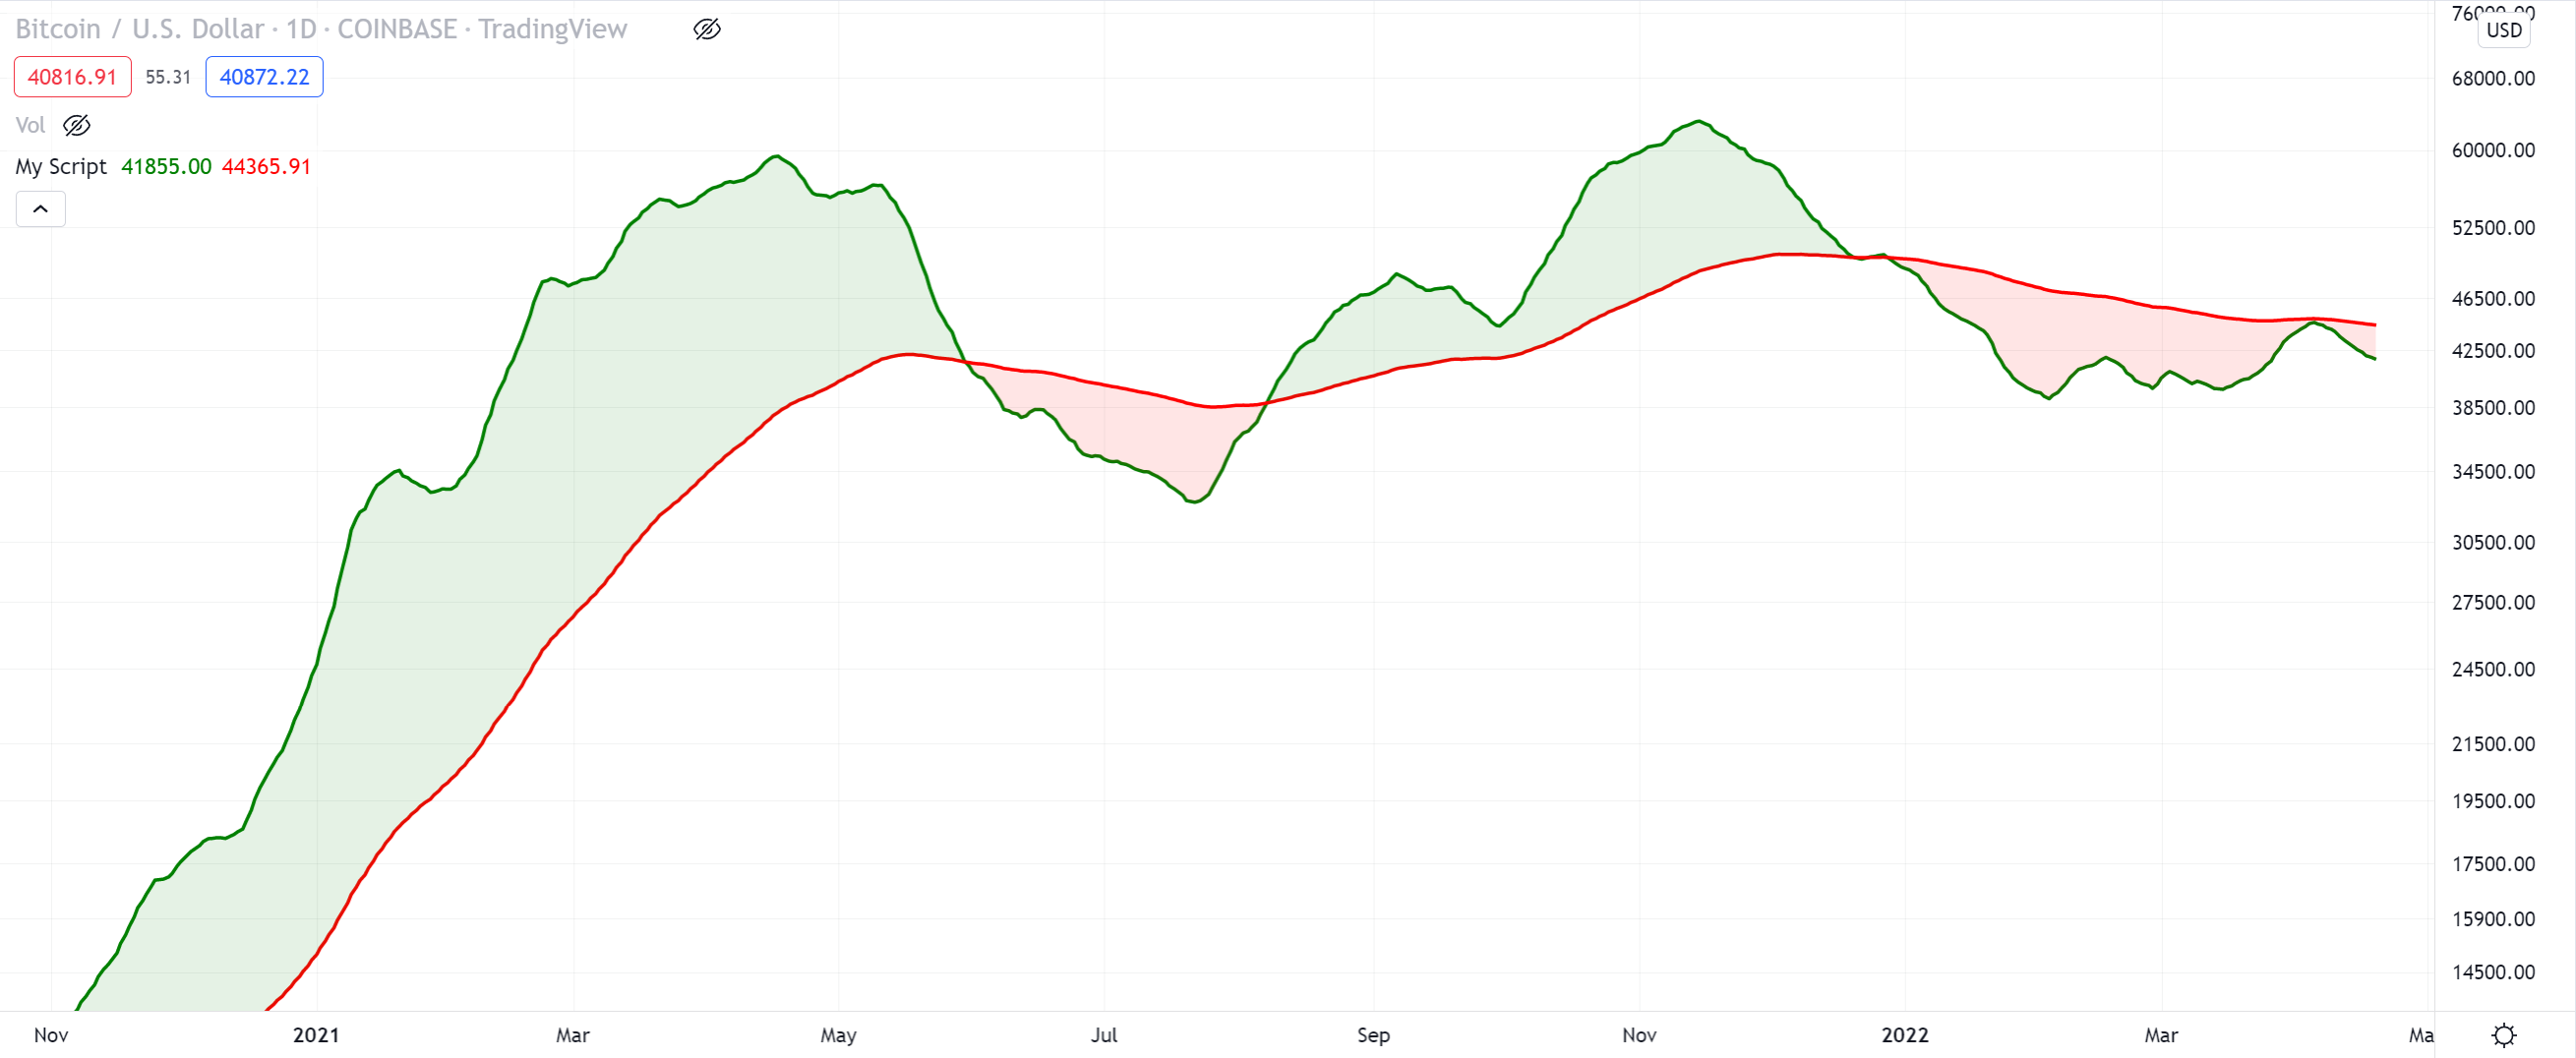
The Bitcoin cloud indicator is made up of a green line (21-day EMA) and a red line (200-day EMA), with the space between them colored in order to show the sentiment of the market price-wise. The indicator works with any exchange, but for a fuller picture we have used Coinbase:
Let’s look at some examples of prior bull runs on the chart. The first example covers the start of the 2016-2017 bull run:
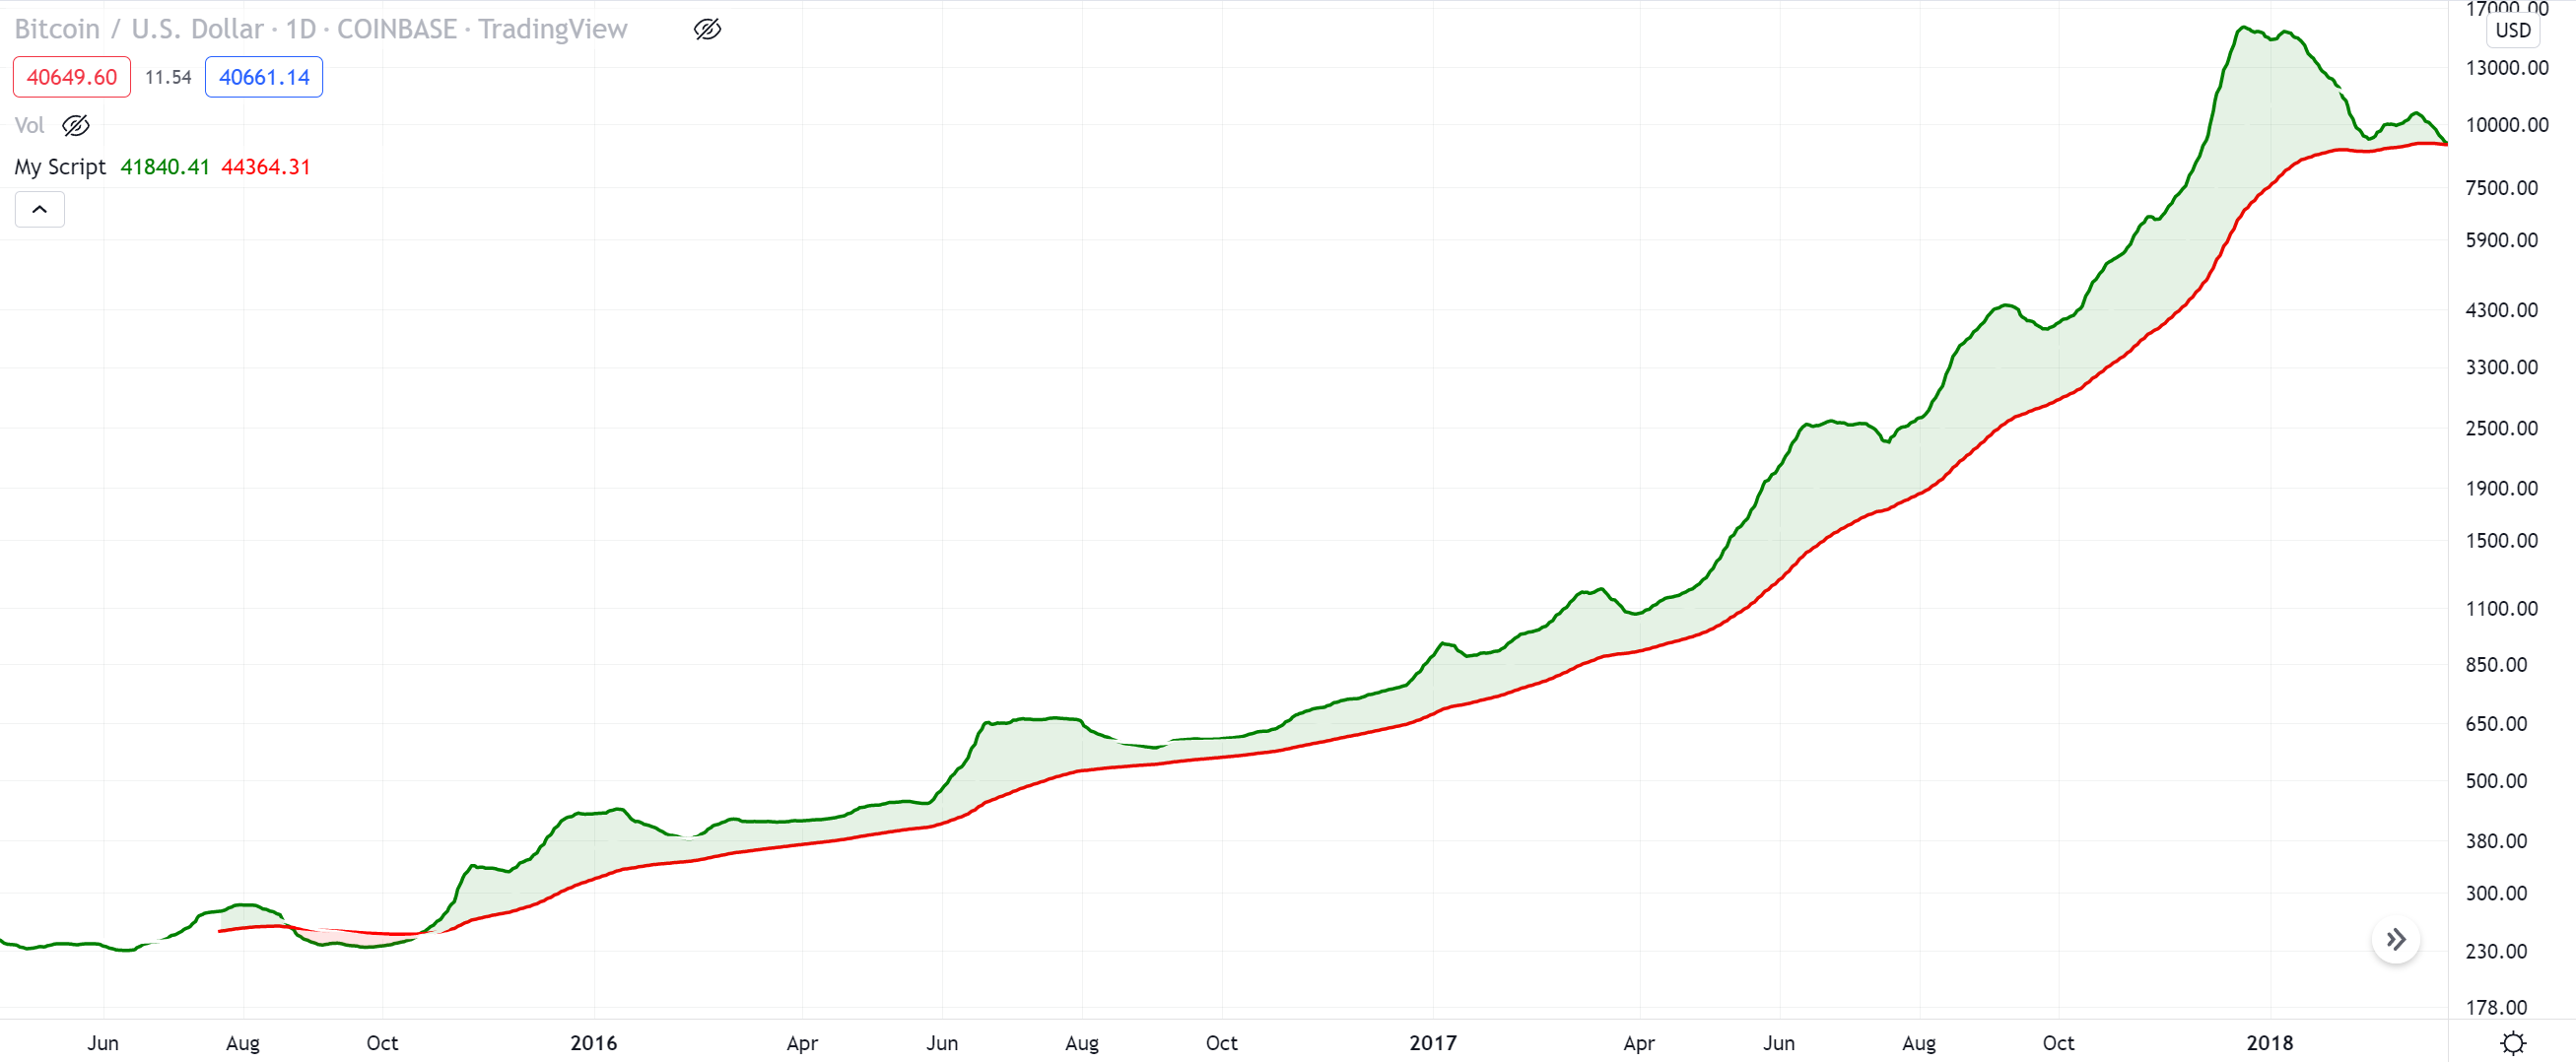
As we can see, the entire run from October 2015 to December 2017 is easy to spot, with the green line staying above the red line throughout the entire move upwards from $300 at the time the bullish cross took place to the collapse from $20,000 to $10,000 in January 2018.
Once the two lines met up again, this spelled the start of a correction:
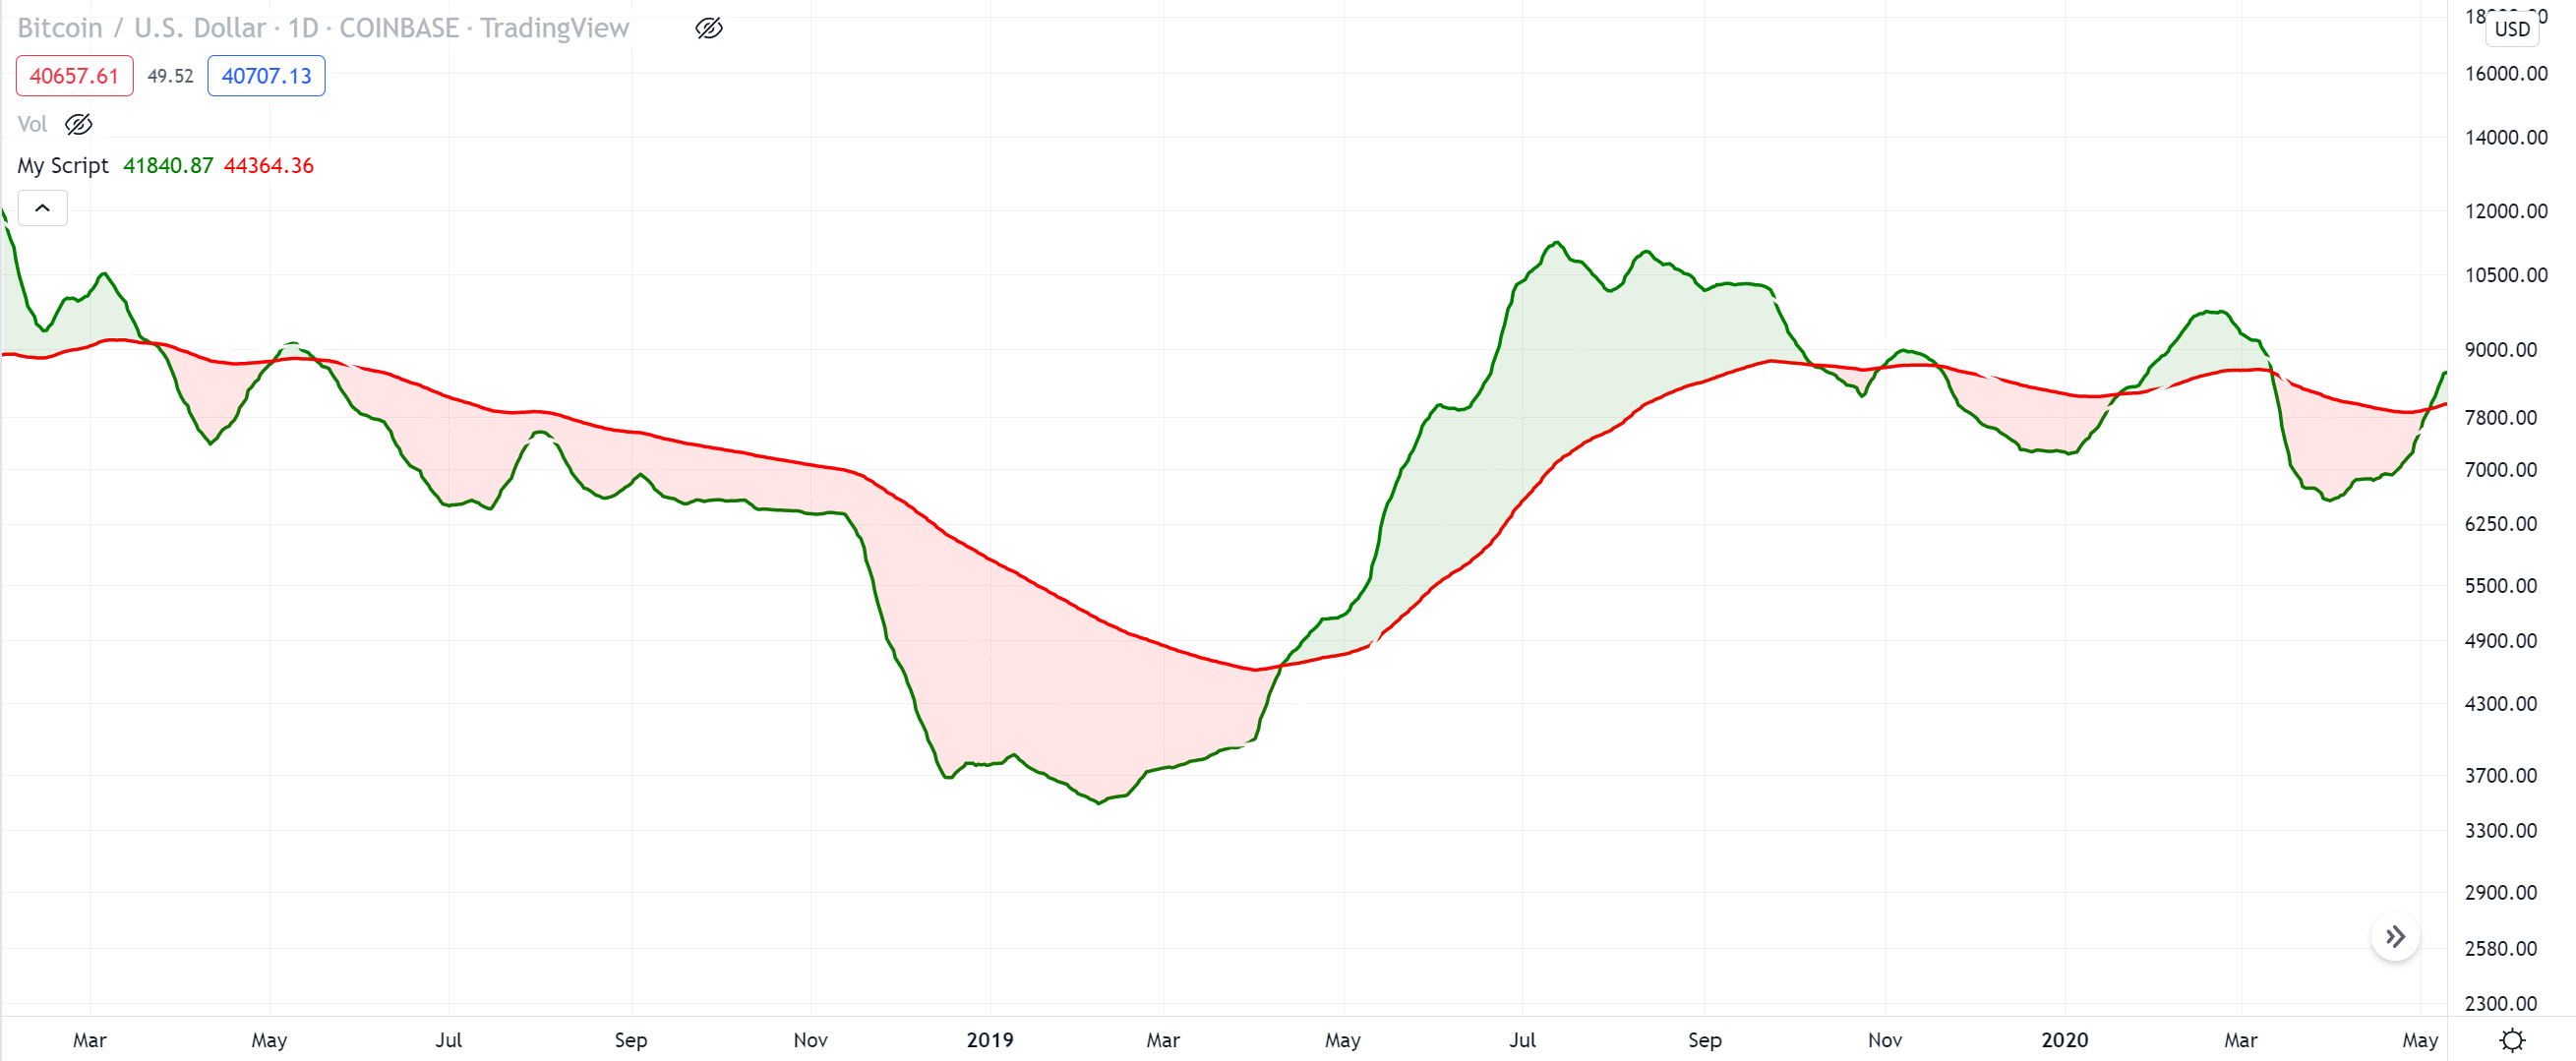
This period of negative price action is typified by rejected attempts of the green line to cross above the red, and even when it managed it in March 2019 this was only temporary, with more fluctuation later on in the year and into 2020.
The exact same pattern repeated in May 2020 when green crossed above the red and remained above it as the red line curved upwards as price rallied from $10,000 to $60,000:
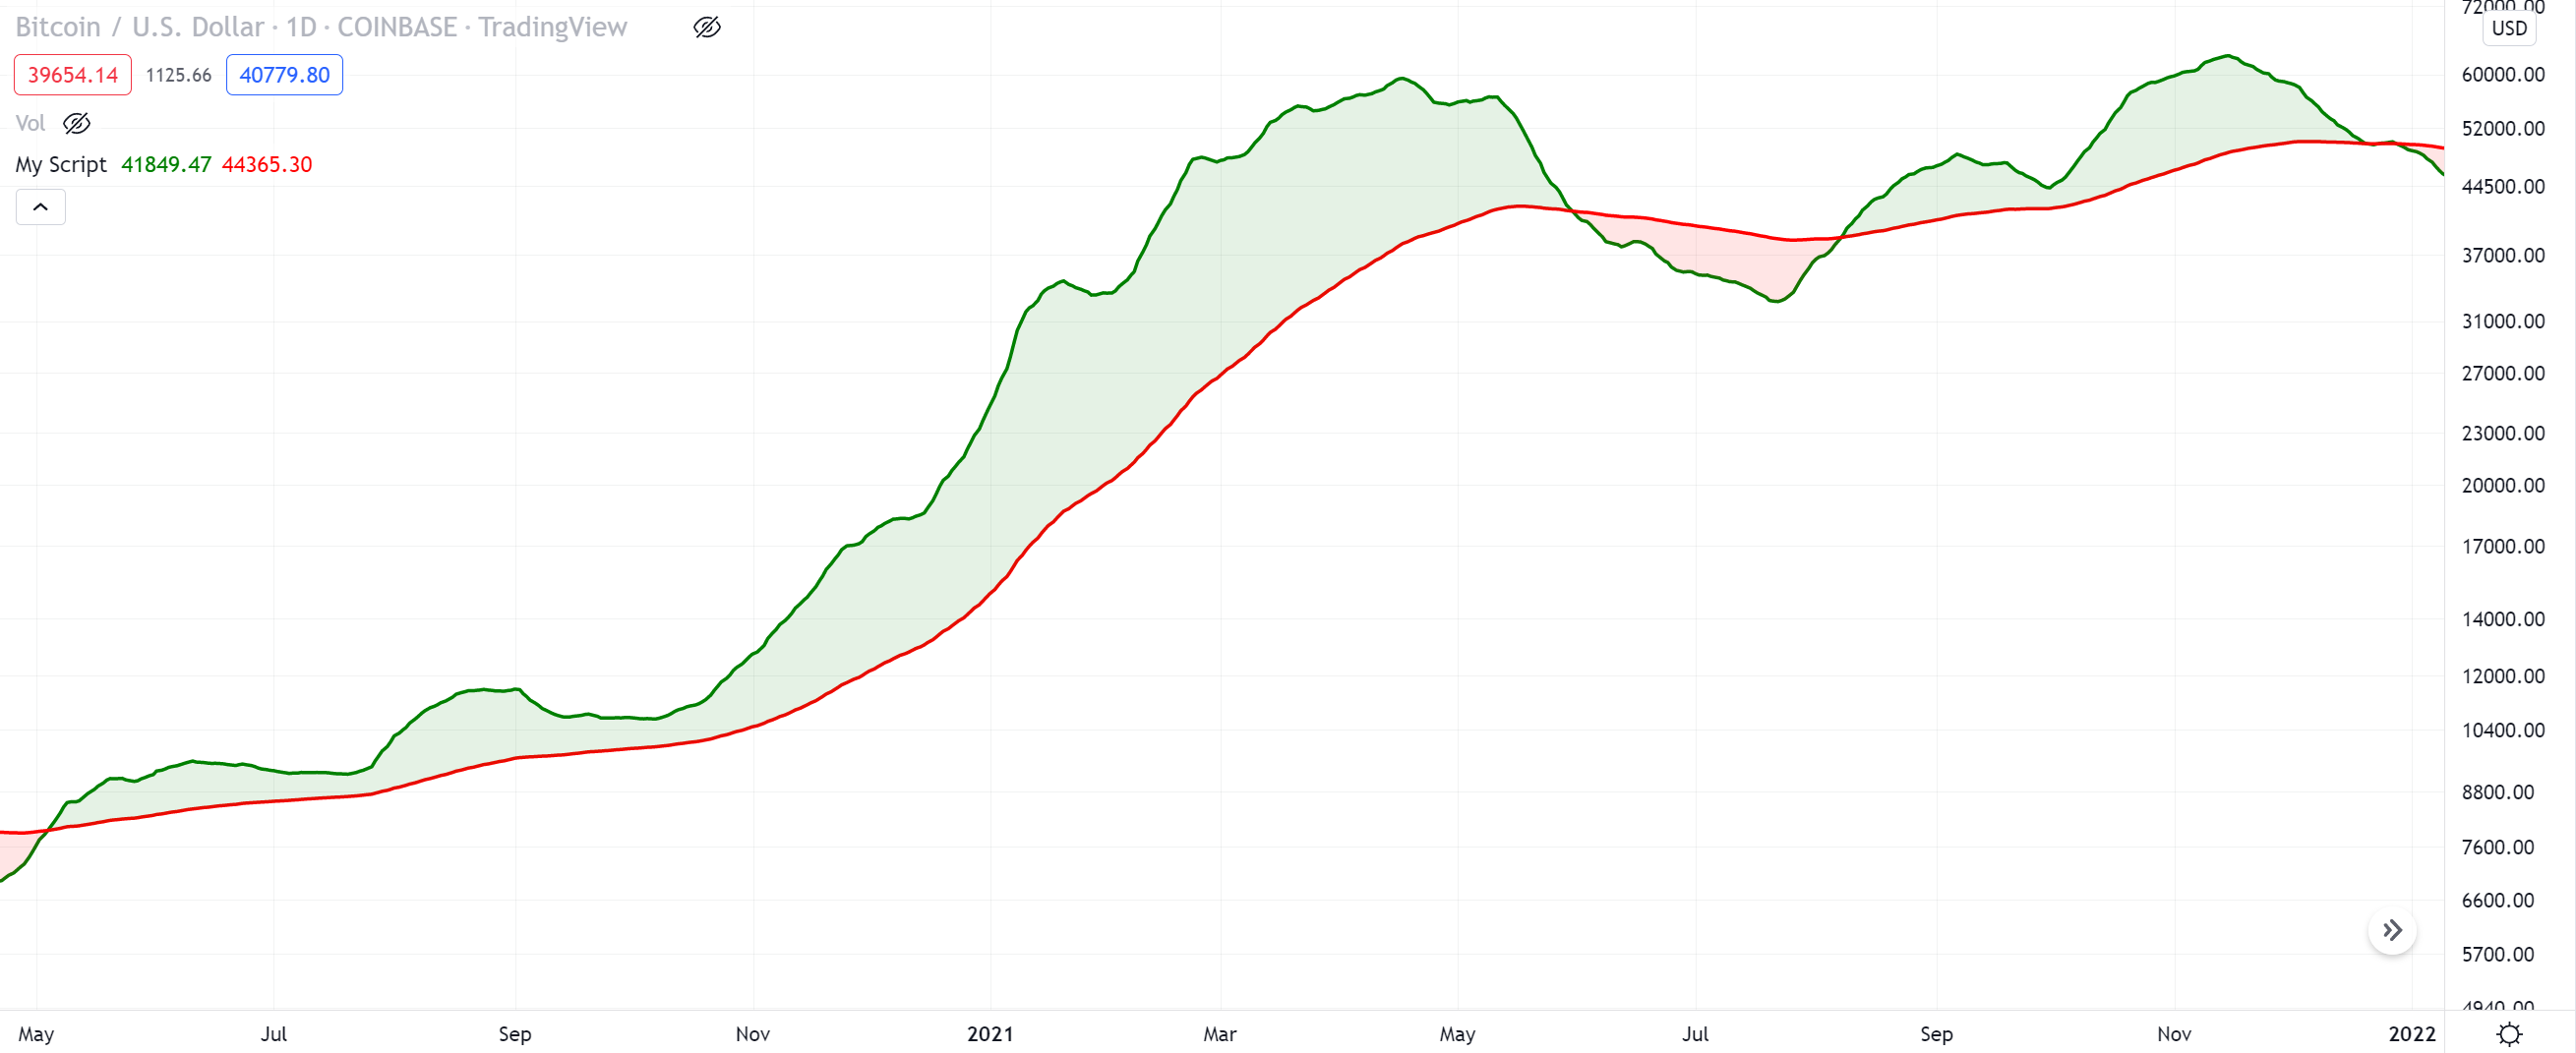
The topping out was followed by a short-lived post-blowoff rally in November 2021 which failed to yield further highs and led five months of brutal price action that punished all but the most proficient traders.
Bitcoin Currently in No-man’s Land
A look at the Bitcoin cloud at the moment shows that we are still in the middle of a period of slowdown, with an attempted bullish cross in early April being rejected and the red line still trending downwards:
So what does this mean for the average trader? If history is our guide, you should not entertain thoughts of taking a position until a bullish cross takes place at the same time as the red line is curving upwards. Only these two factors together are confirmation (or as close as we can get it) that a new market cycle is beginning, and buying before this risks price retreating further before improving.
Don’t worry about missing out on those early gains while waiting for such confirmation – most cryptocurrency traders only make money in the latter two thirds of the bull run when the ‘up only’ meme is at its strongest, and you don’t want to jump in too early and risk losing everything because the market is not yet ready.