- Bitcoin looks like it is about to correct from $16,000 after a parabolic run
- Such parabolic runs have seen Bitcoin correct over 80% in the past
- There are reasons to think that this will not be the case this time round however
Bitcoin and parabolic rises go hand in hand, and so do the corrections that follow. 80% corrections are not uncommon for Bitcoin following the kind of move we have seen since March which has taken Bitcoin from $3,800 to $16,000. History has shown us that massive rises result in massive corrections, so are we in for another dark crypto winter or is there reason to think that brighter skies lie ahead?
Bitcoin’s Parabolic History
The most famous parabolic move Bitcoin has ever enjoyed was of course in 2017 when it hit all time highs of $20,000 in December of that year. This was followed by an 82.5% correction that took two years to play out:

Before 2017 came the biggest of two parabolic moves in 2103 which saw Bitcoin hit $1,160 in November 2013 before correction to $150, an 87% drop that took over two years to run its course:
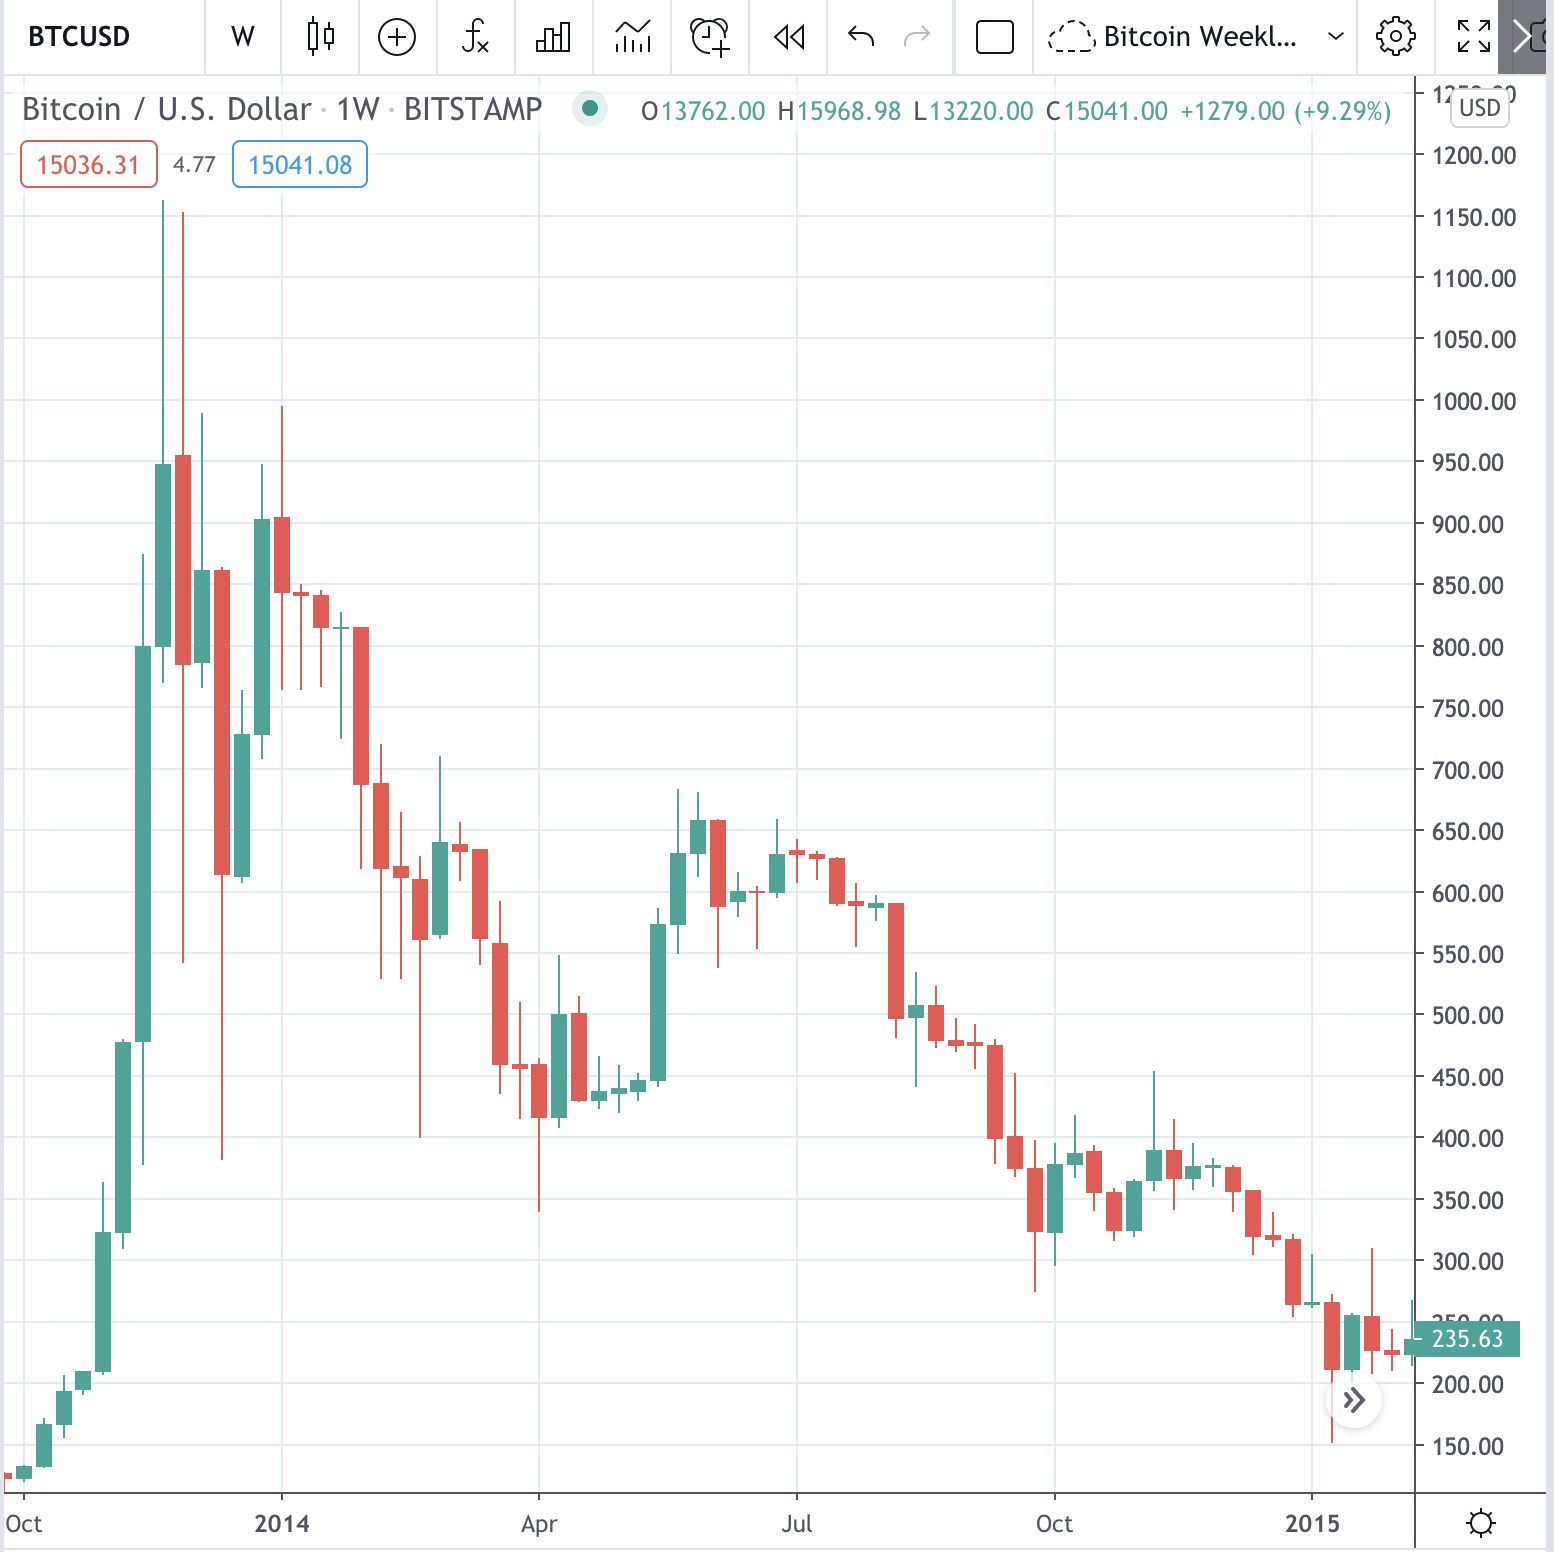
History suggests then that when Bitcoin enjoys a parabolic move, a lengthy and almost total correction follows. These examples should rightly have us fearful of what could be in store for Bitcoin, given that it has almost exclusively gone up since March, rising from $3,800 to $16,00 without a major correction. Following such a pattern would see us fall back to $3,200 by February 2022, which is almost unthinkable given how far Bitcoin has come fundamentally since 2017 – almost as unthinkable as thinking in December 2017 that Bitcoin would drop back to $3,120.
Reasons To Be Cheerful
All is not lost, however. Setting aside Bitcoin’s increased fundamental strength compared to prior years, there is another reason why things are different this time round – the timing. The 2013/14 and 2017 parabolic moves came at the end of lengthy bull markets, representing the peak of years of accumulation and upward price action. This explains the huge correction afterwards.
We have two examples of times when Bitcoin went on a parabolic run and reacted far less aggressively. Prior to the November 2013 parabolic move above, Bitcoin enjoyed an initial parabolic run in April of that year:
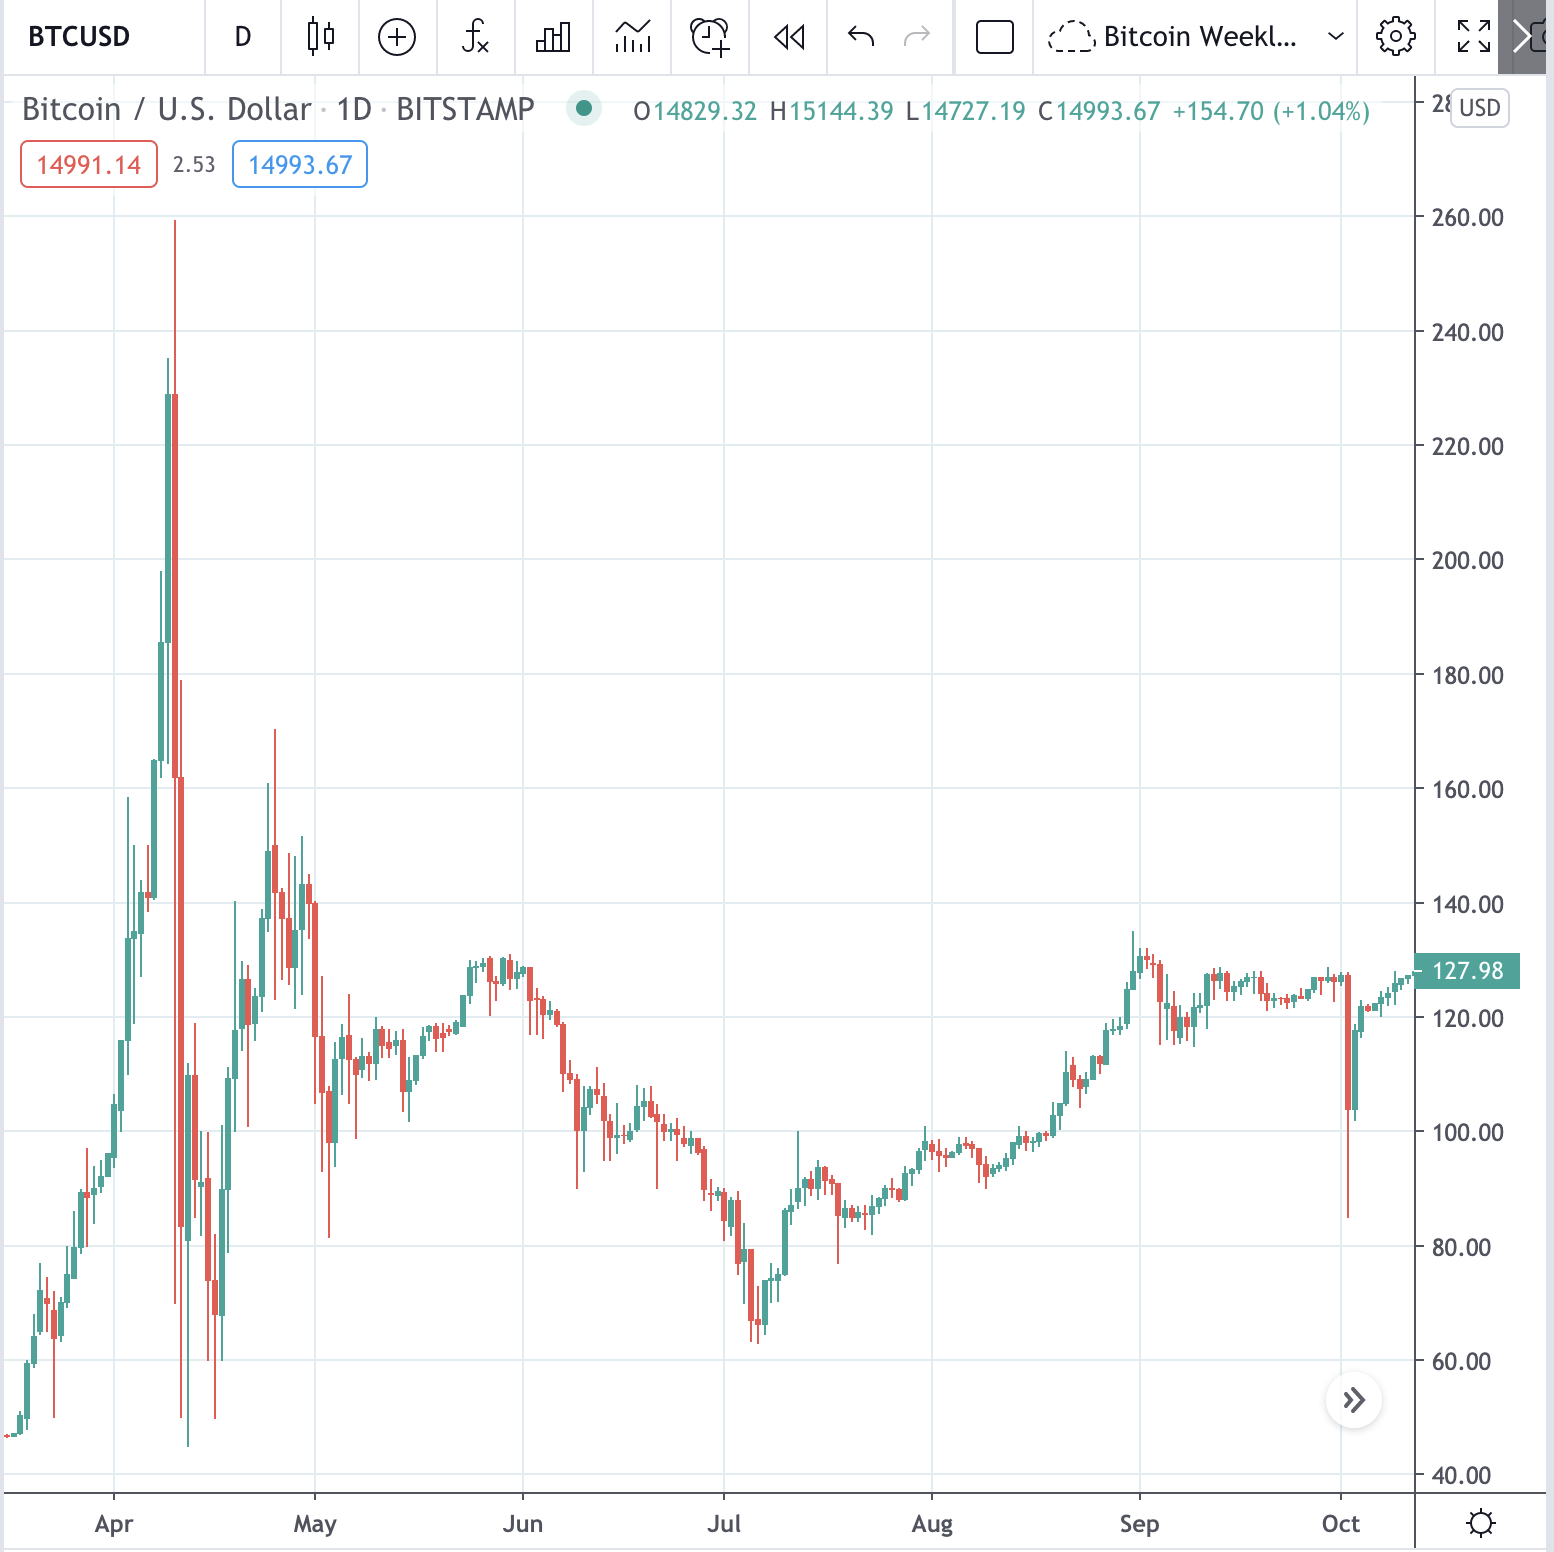
As we can see, while Bitcoin did endure a flash correction of 83%, it quickly rebounded and shrugged off suggestions of a multi-year bear market by leading into the actual bull market just seven months later.
Similarly, in 2019 Bitcoin rocketed from its bear market bottom of $3,120 to $14,000 within six months, topping out in June. Once again, an 80% correction and multi-year bear market failed to materialize, as the price only dropped 53% before resuming the uptrend (setting aside the black swan of the March crash):
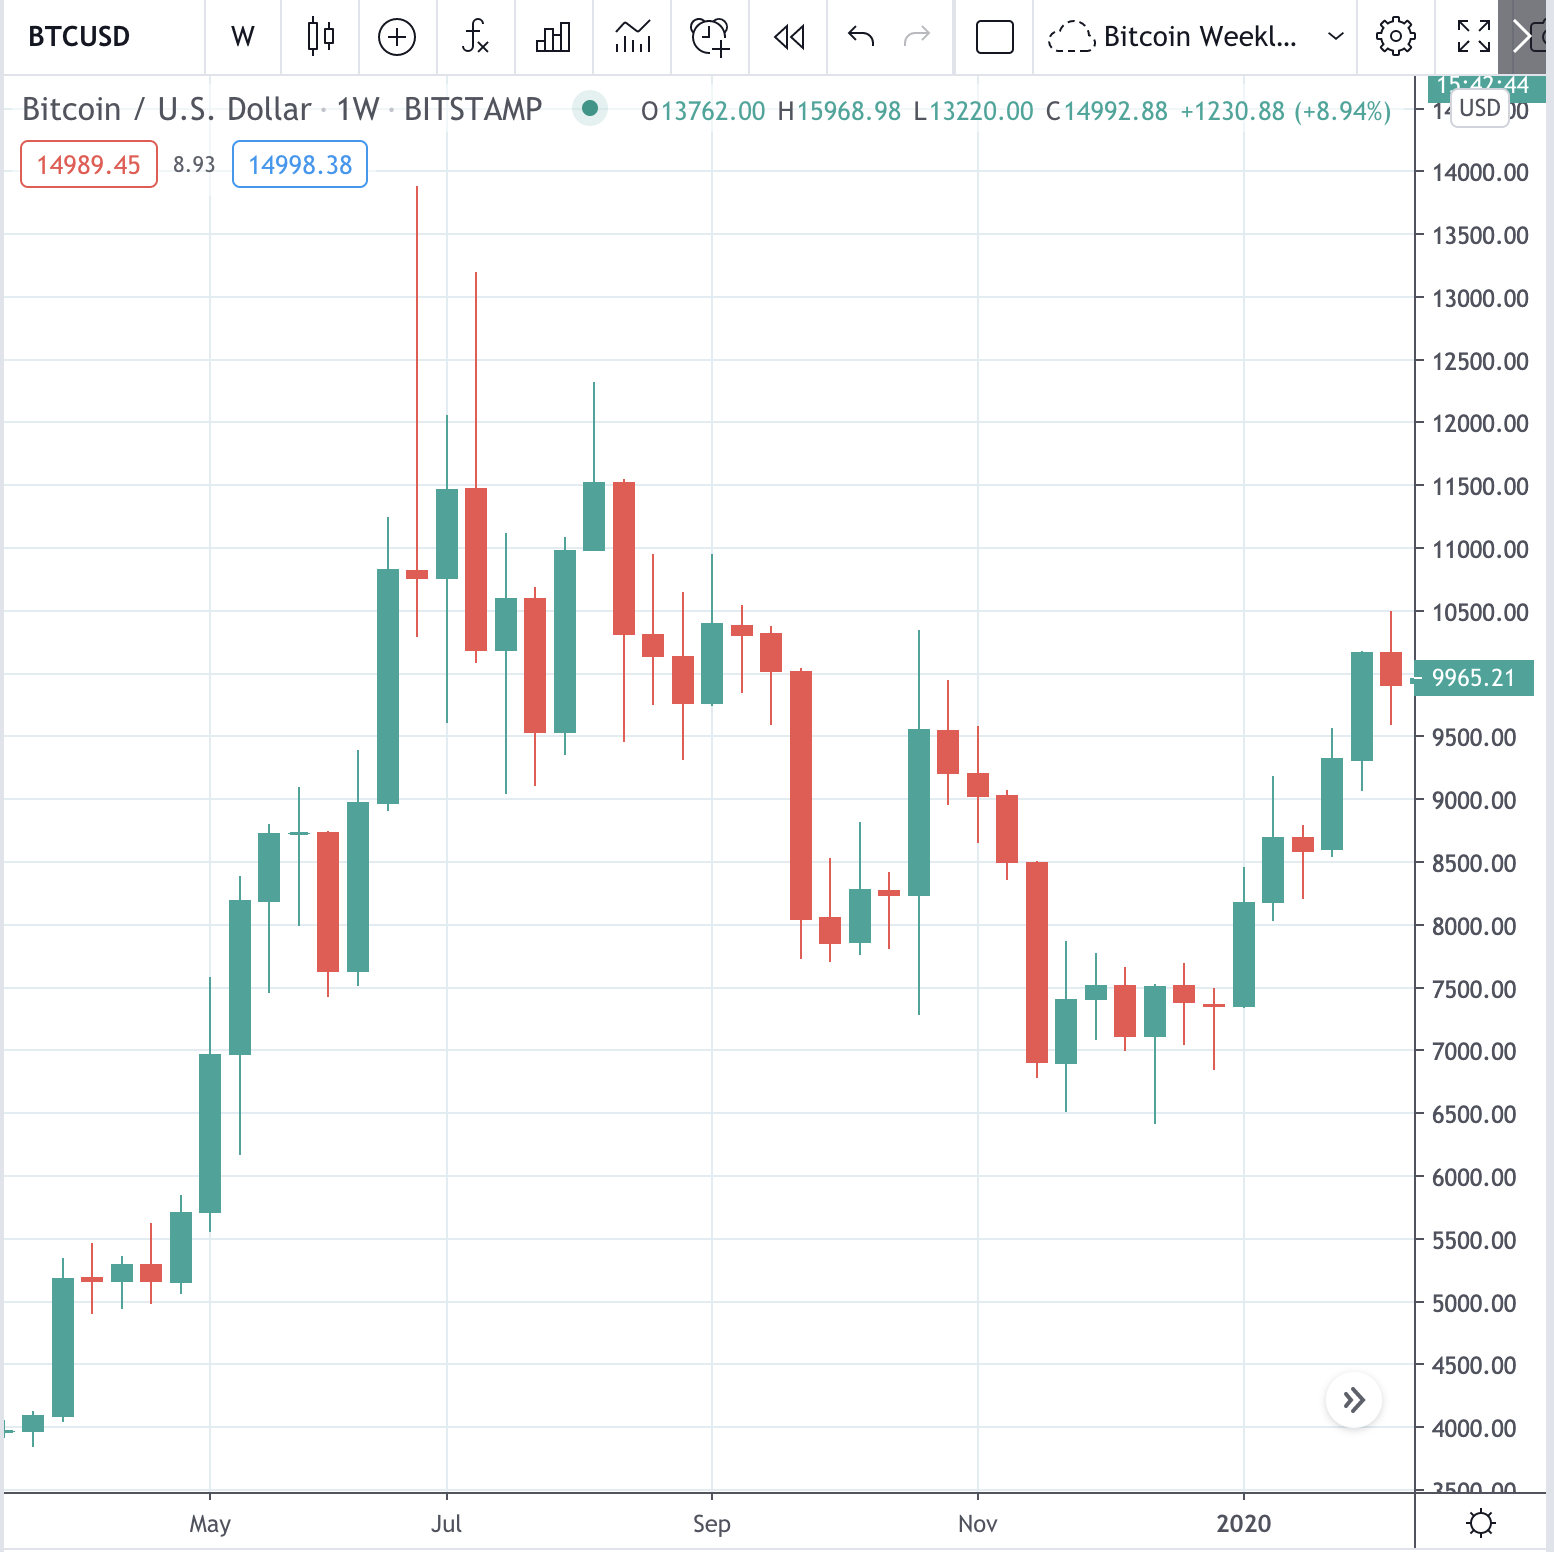
The difference seems to be when the parabolic run takes place within the cycle. Parabolic runs that have taken place shortly after a bear market structure was broken (April 2013 and 2019) have resulted in less aggressive corrections and further upside afterwards, while parabolic runs that have taken place at the end of multi-year bull markets (November 2013 and 2017) have resulted in 80% correction and lengthy bull markets.
Bitcoin only broke its two and a half year bear market in July, so we can be fairly confident that this run to $16,000 is not the big one and that an 80% correction is not on the cards this time round. Even a 50% correction to $8,000 is an extreme consideration, all of which leaves us with a much more exciting prospect – the real bull market is yet to come.