- $20,000 is a natural and obvious area of support for Bitcoin
- Below that, things get a little messy
- We can find a very clear next support level when looking at the monthly chart however
$20,000 has become a strong psychological barrier for Bitcoin, but with many portents of doom coming from various well placed individuals, it is certainly worth looking at lower levels of support. The monthly timeframe isn’t something we typically look at, but in this case it could hold the key to where Bitcoin might finally bottom out if $20,000 doesn’t hold.
$13,800 is Key Support on Bitcoin Monthly
On a weekly timeframe we can see just how important $20,000 is for Bitcoin:
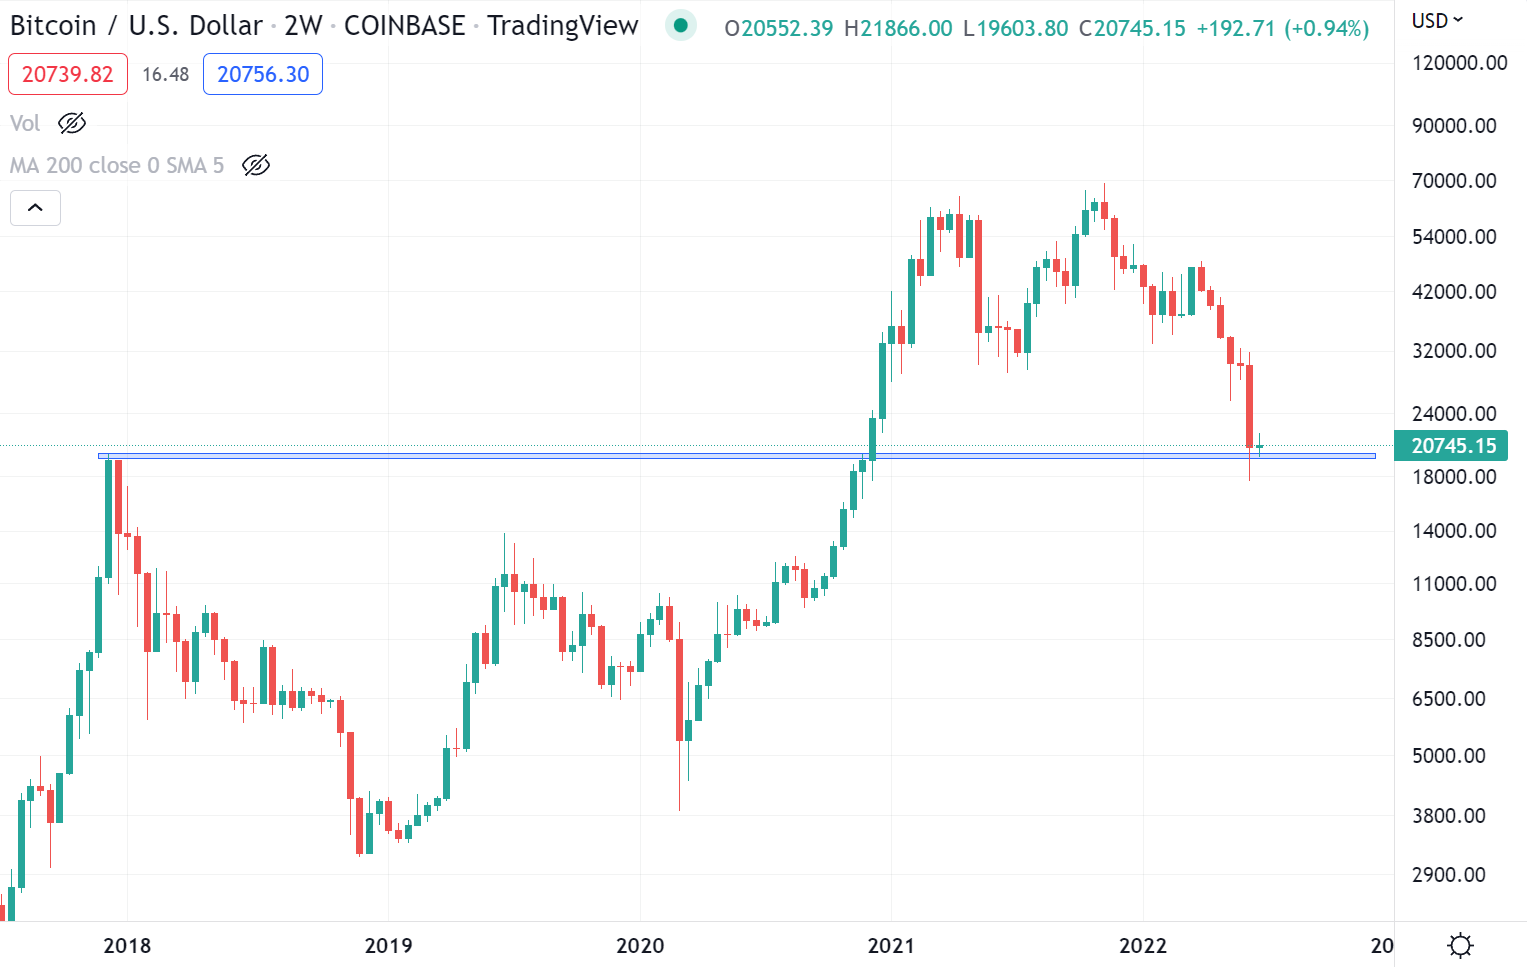
Having wicked below it 10 days ago it now sits right on top of this key support line, potentially forming the base for the bear market, with maybe one more capitulation wick beneath it deeper into the bear market in order to flush out any last remaining hope.
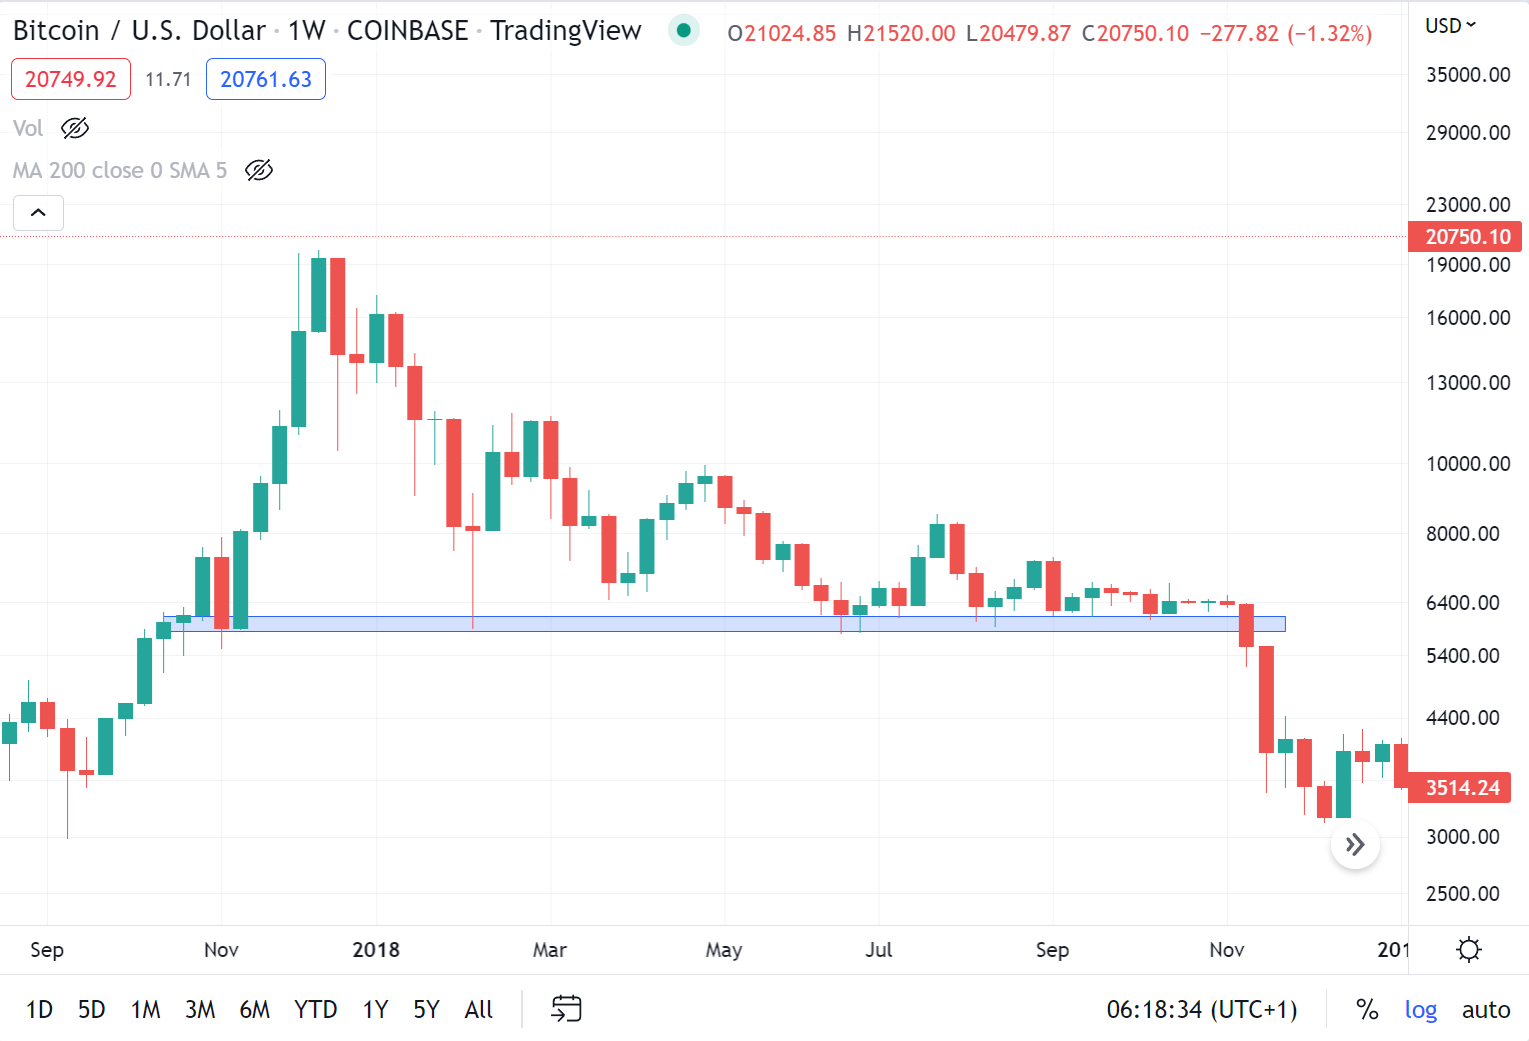
However, if we are in for a repeat of 2018 we could see a pattern such as this, where the baseline held for an entire year before falling right at the end:
If we are presented with this same scenario, where could Bitcoin bottom out? To help with this we can turn to the monthly chart, which is able to offer a very strong candidate for this:
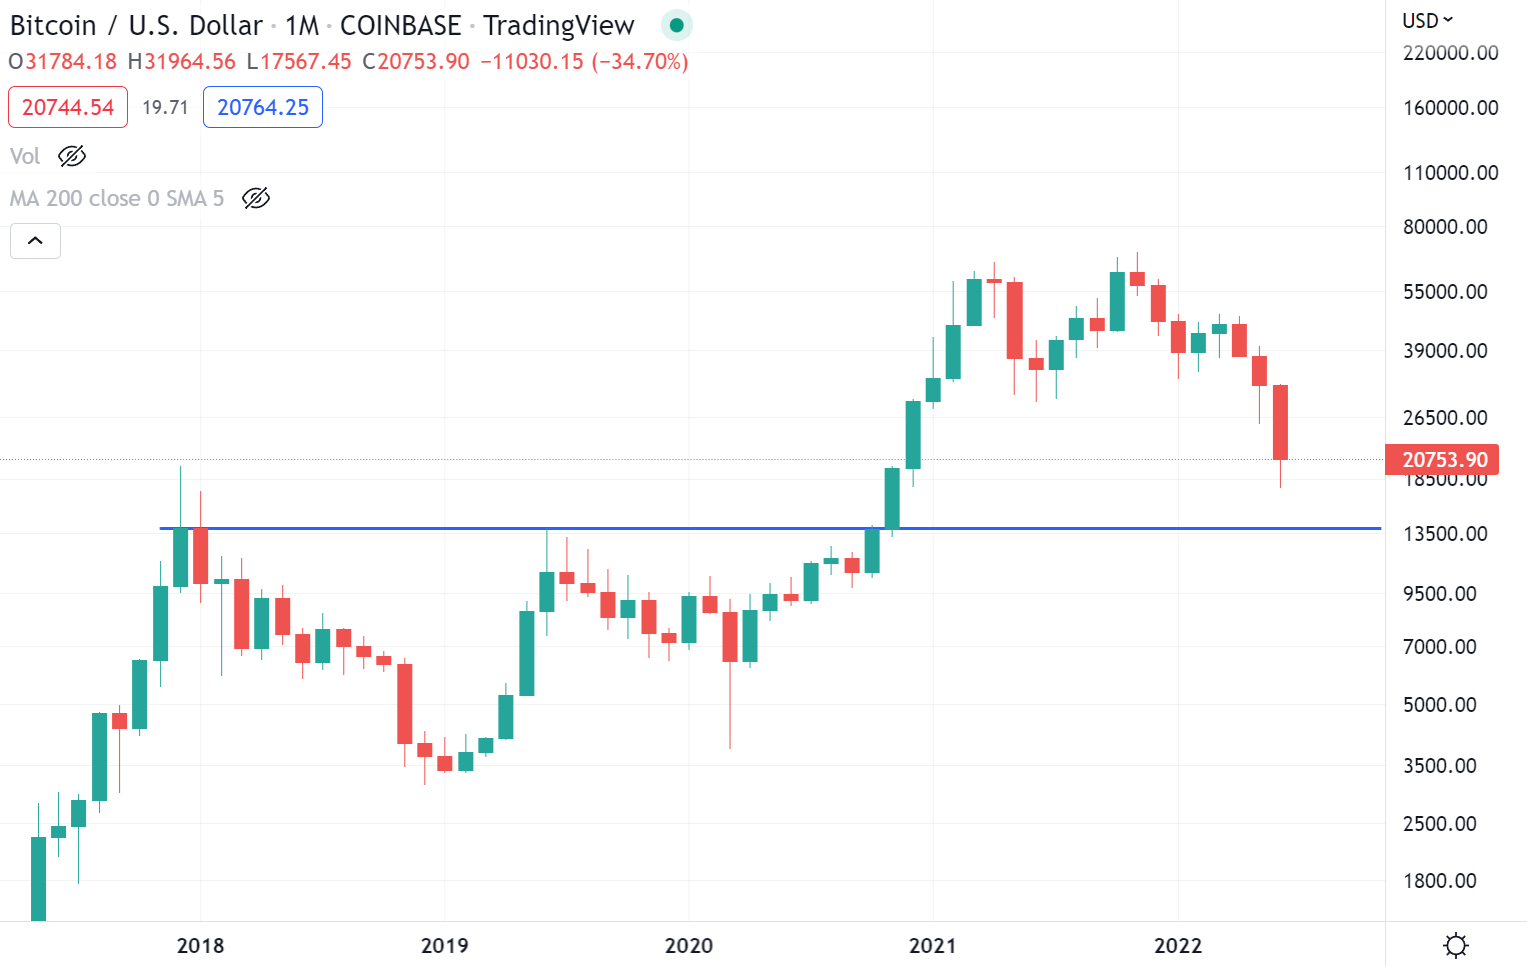
As we can see, this level at around $13,800 was very important on three occasions between 2018 and 2019, including acting as the top of the 2019 bounce. On a monthly level at least there is nothing in between $20,000 and $13,800 that offers and areas that could be of probable support, although on a weekly timeframe $16,200 has potential, but if things get as bad as many are predicting they will then this is certainly an area to be placing your bids.
If things play out according to this thesis we could see something like this playing out over 2022/23:
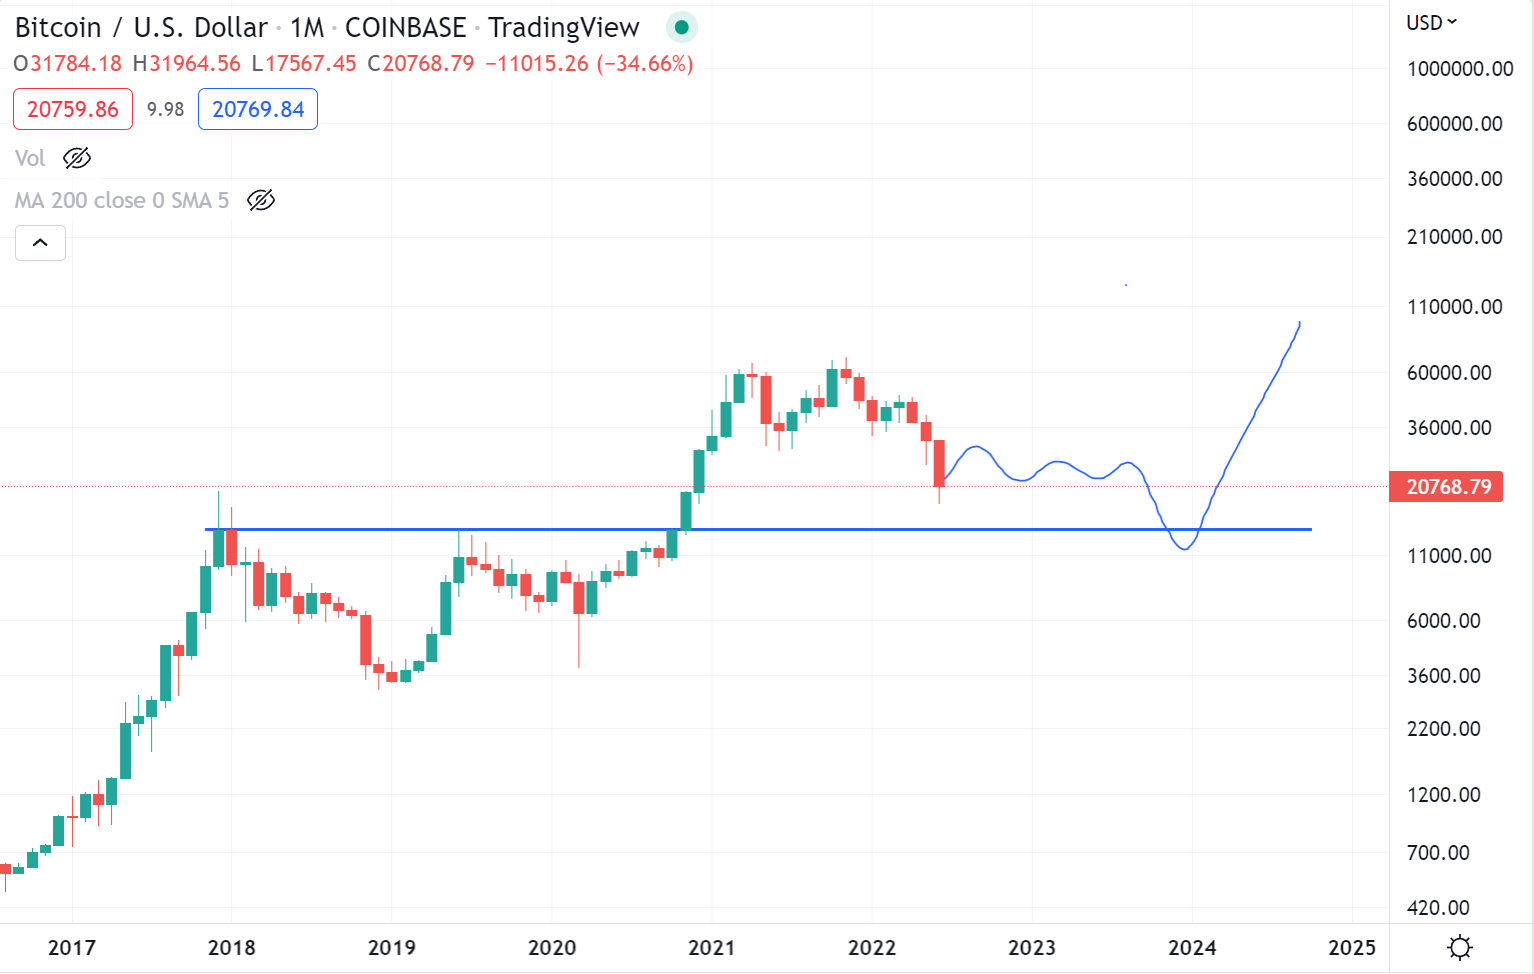
This would be very similar in principle to 2019/20, with a final capitulation taking liquidity below $14,00 as the final flush before a move up.
How accurate this will be of course nobody knows, but one thing we do know is that we will have a lot of time to find out.