- Bitcoin has endured a 35% correction since hitting $65,000 in April
- Was this a typical Bitcoin correction or is there a bigger correction at play?
- Long term charts are a good way to analyze the current position
For some, the past few weeks have been confirmation that the Bitcoin bull run is over. Since hitting $64,830 a month ago, Bitcoin has been in a negative trend, shedding over $20,000, with Elon Musk assisting in its decline. However, even if it hadn’t been for the Dogeking getting his kicks stomping on other people’s portfolios, Bitcoin was always set for a retest. The question is, was this just another Bitcoin bull run correction or the beginning of the end of the cycle?
Buy the Dip or Sell the Bounce?
Bitcoin and double-digit drops are as common as Tesla and car crashes. We have seen several 20%+ corrections since March 2020 but only one 30%+ correction, making this the biggest corrective wave since the 50% crash. Compare this to the 2015-2017 run where we saw eight corrections of 28% or more. This would suggest that bitcoin was due a big correction, especially after its hot streak to $65,000.
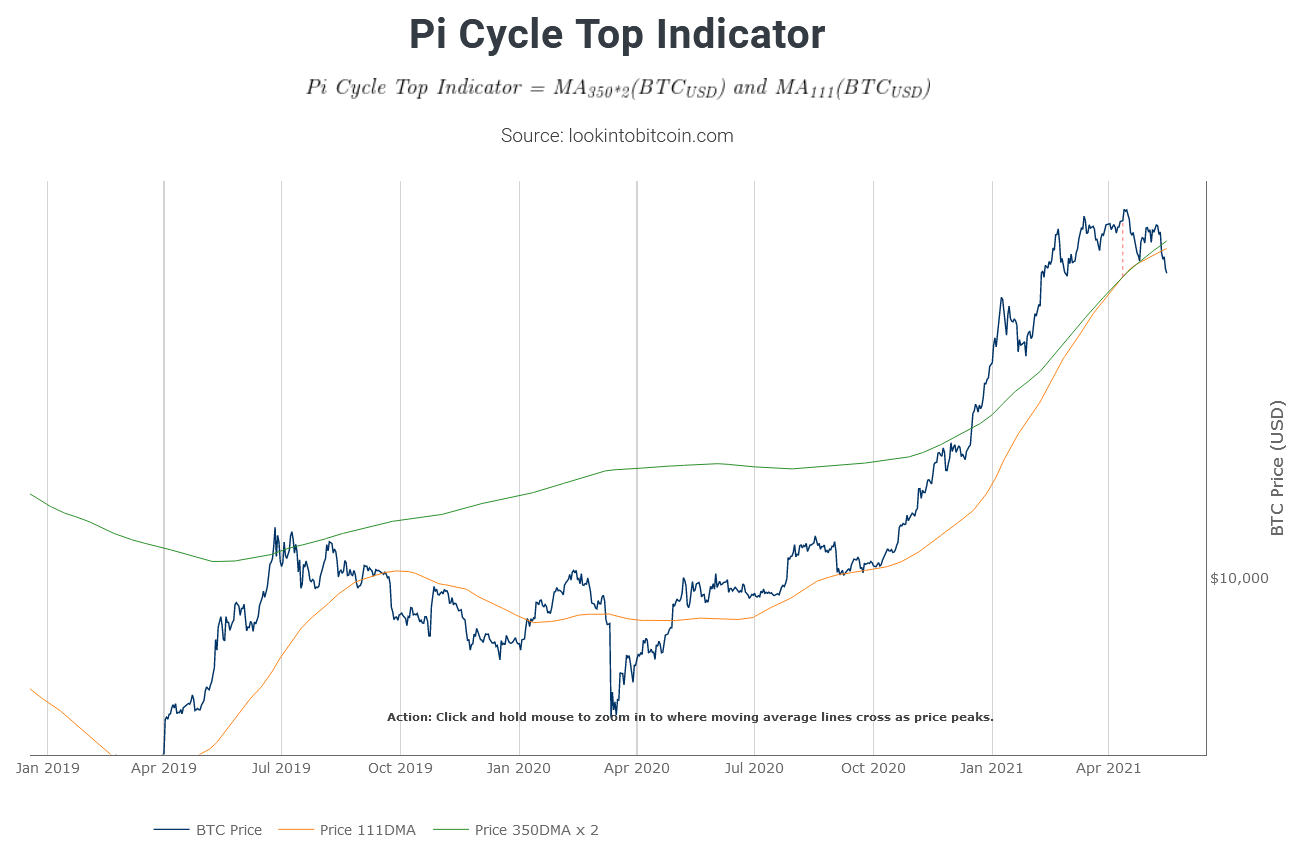
In situations such as these we need to look at a longer-term chart to see where we are in the greater cycle. One such chart which we have discussed before is the Pi Cycle Top Indicator, which has successfully identified market tops in previous years. It could be argued that once again it is on the right track:
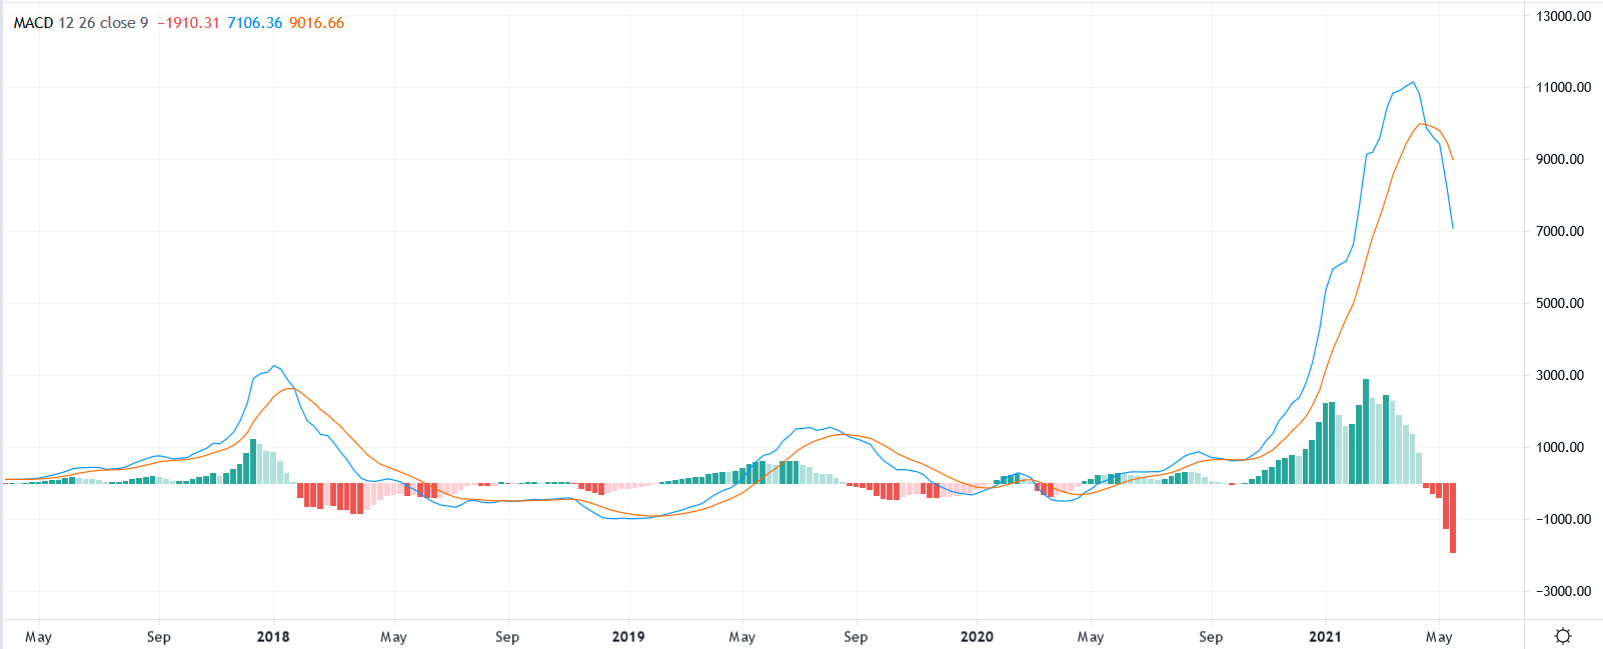
We can back up this suggestion with a look at the MACD, which follows the same pattern seen in January 2018 and September 2019 and crossed bearish after a long bullish runup:
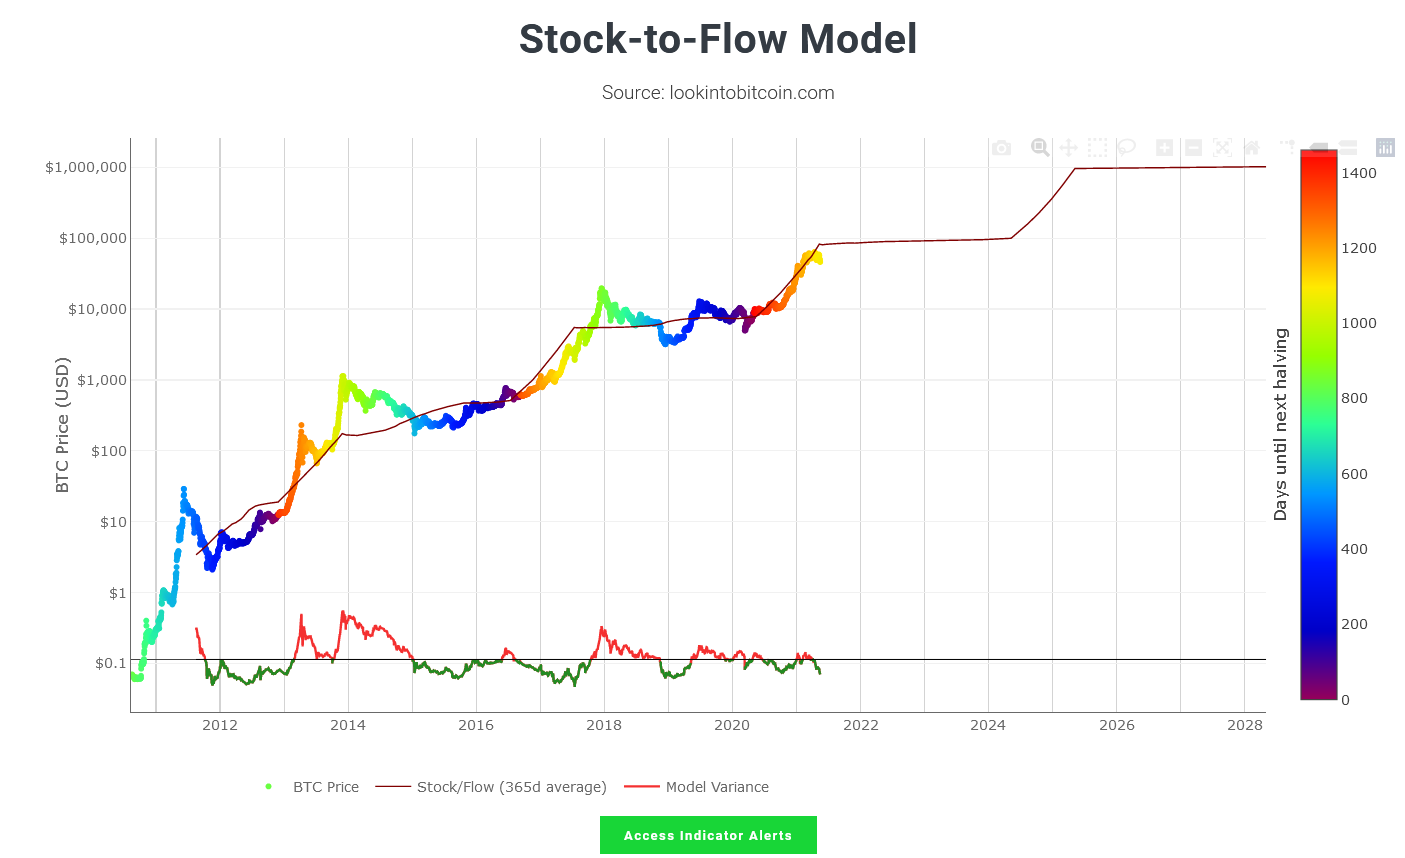
On one hand this seems conclusive, but other tools show a different side to the same price action. The Stock-to-flow Model for example shows that we still have some positive momentum to go in the cycle:
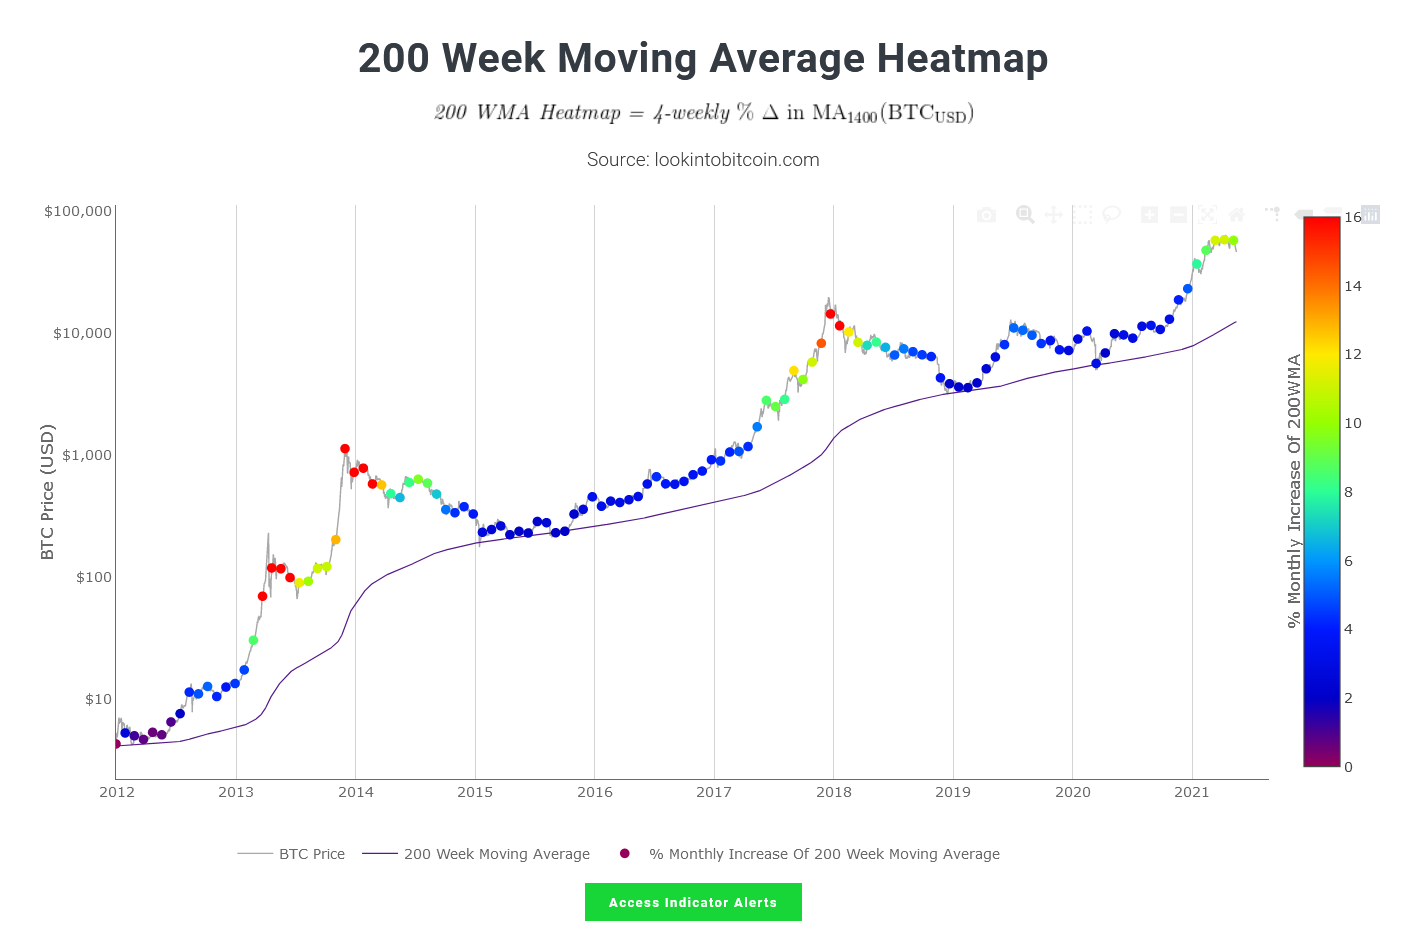
Similarly, the 200-week MA heatmap still hasn’t produced any of the tell-tale red dots that symbolize a potential topping out:
We can also get a good idea of Bitcoin’s long term position by looking at the Logarithmic Growth Curve:
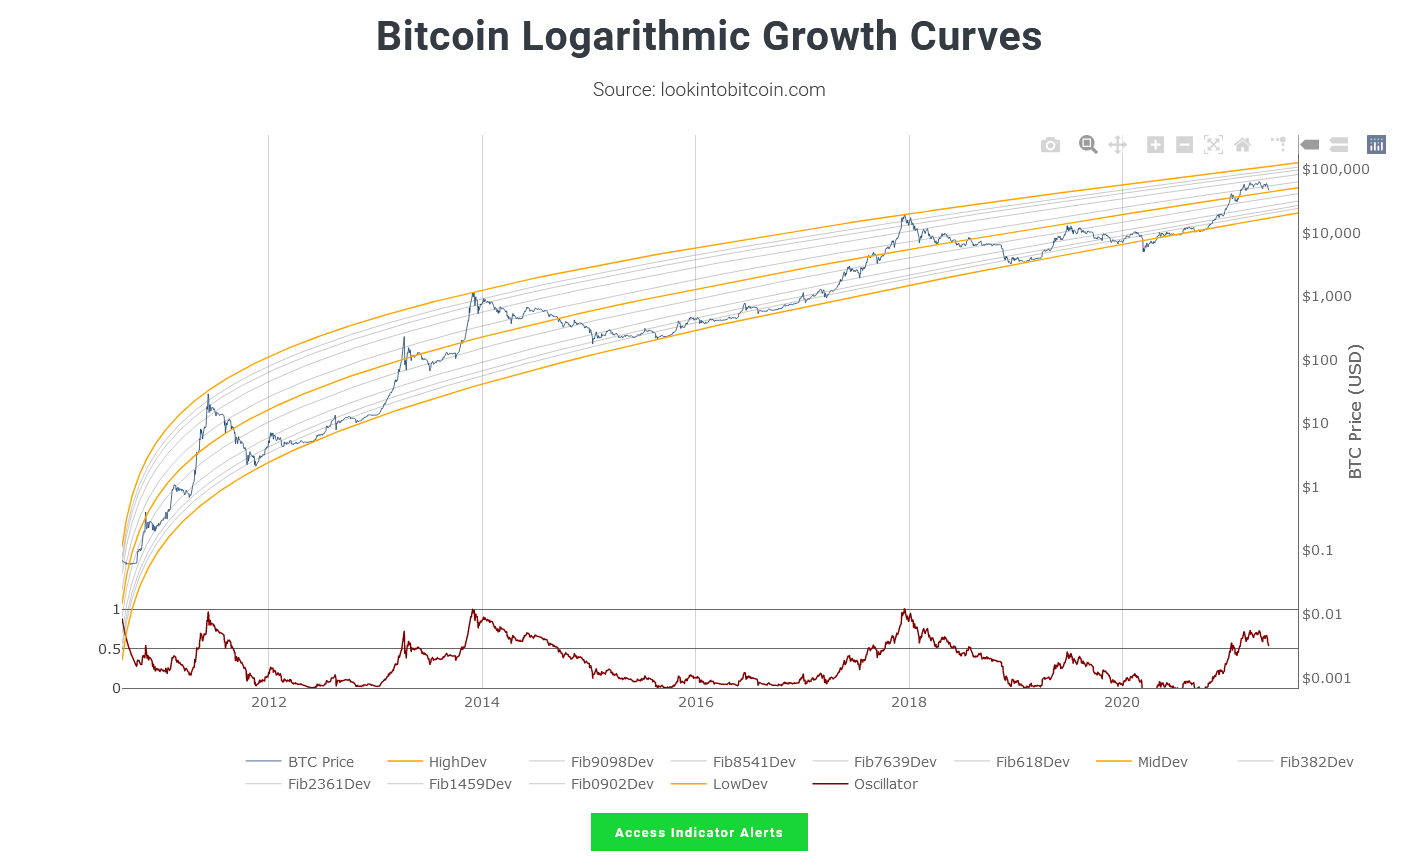
This chart suggests that Bitcoin is close to correcting to the median line. If it holds above this line then we can be hopeful of a continuation in price up to the top of the range in the coming months.
Bitcoin Remains in Precarious Position
The fact that two sets of charts showing opposing outcomes exist from the same datasets illustrates the precarious position Bitcoin is currently in. The truth is of course that no one really knows what Bitcoin has up its sleeve, but what seems a likely outcome given other fundamental factors is that Bitcoin could straddle both camps and endure a mini-bear market before a further move upwards later this year.
Such price action could favor alts hugely, although after five solid months of positive price action it’s up for debate how much room alts have left before they top out.