- When alt season is in full swing it can feel like you’re missing out
- We have seen alts drive up huge gains, but this is just what happened in late 2016
- A proper, mammoth alt season is still ahead of us
With the alt market going crazy and coins doing double figures on consecutive days, it can be tempting to think that the bubble has to burst soon or, if you haven’t made the most of it, that you have missed your opportunity. However, as we can see, there is a very strong argument to suggest that in fact, rather than alt season coming to an end, it is only the beginning and the best is yet to come.
Alt Season Can Set Off Alarm Bells
For those who have been in the market since 2017 or earlier, there is a certain fear associated with a blooming alt season. Mooning prices, spam bots plaguing Twitter posts, and exchanges being backlogged with new registrants are all signs that a bull market is about to come to an end.
Indeed, the last time we saw this combination of factors was the peak of the 2017 bull run, but we tend to forget that a huge alt season occurred in 2016 and early 2017 before Bitcoin began making headlines on the road to $20,000.
The following chart, courtesy of Twitter user @damskotrades, illustrates how far into the alt coin cycle we actually are:
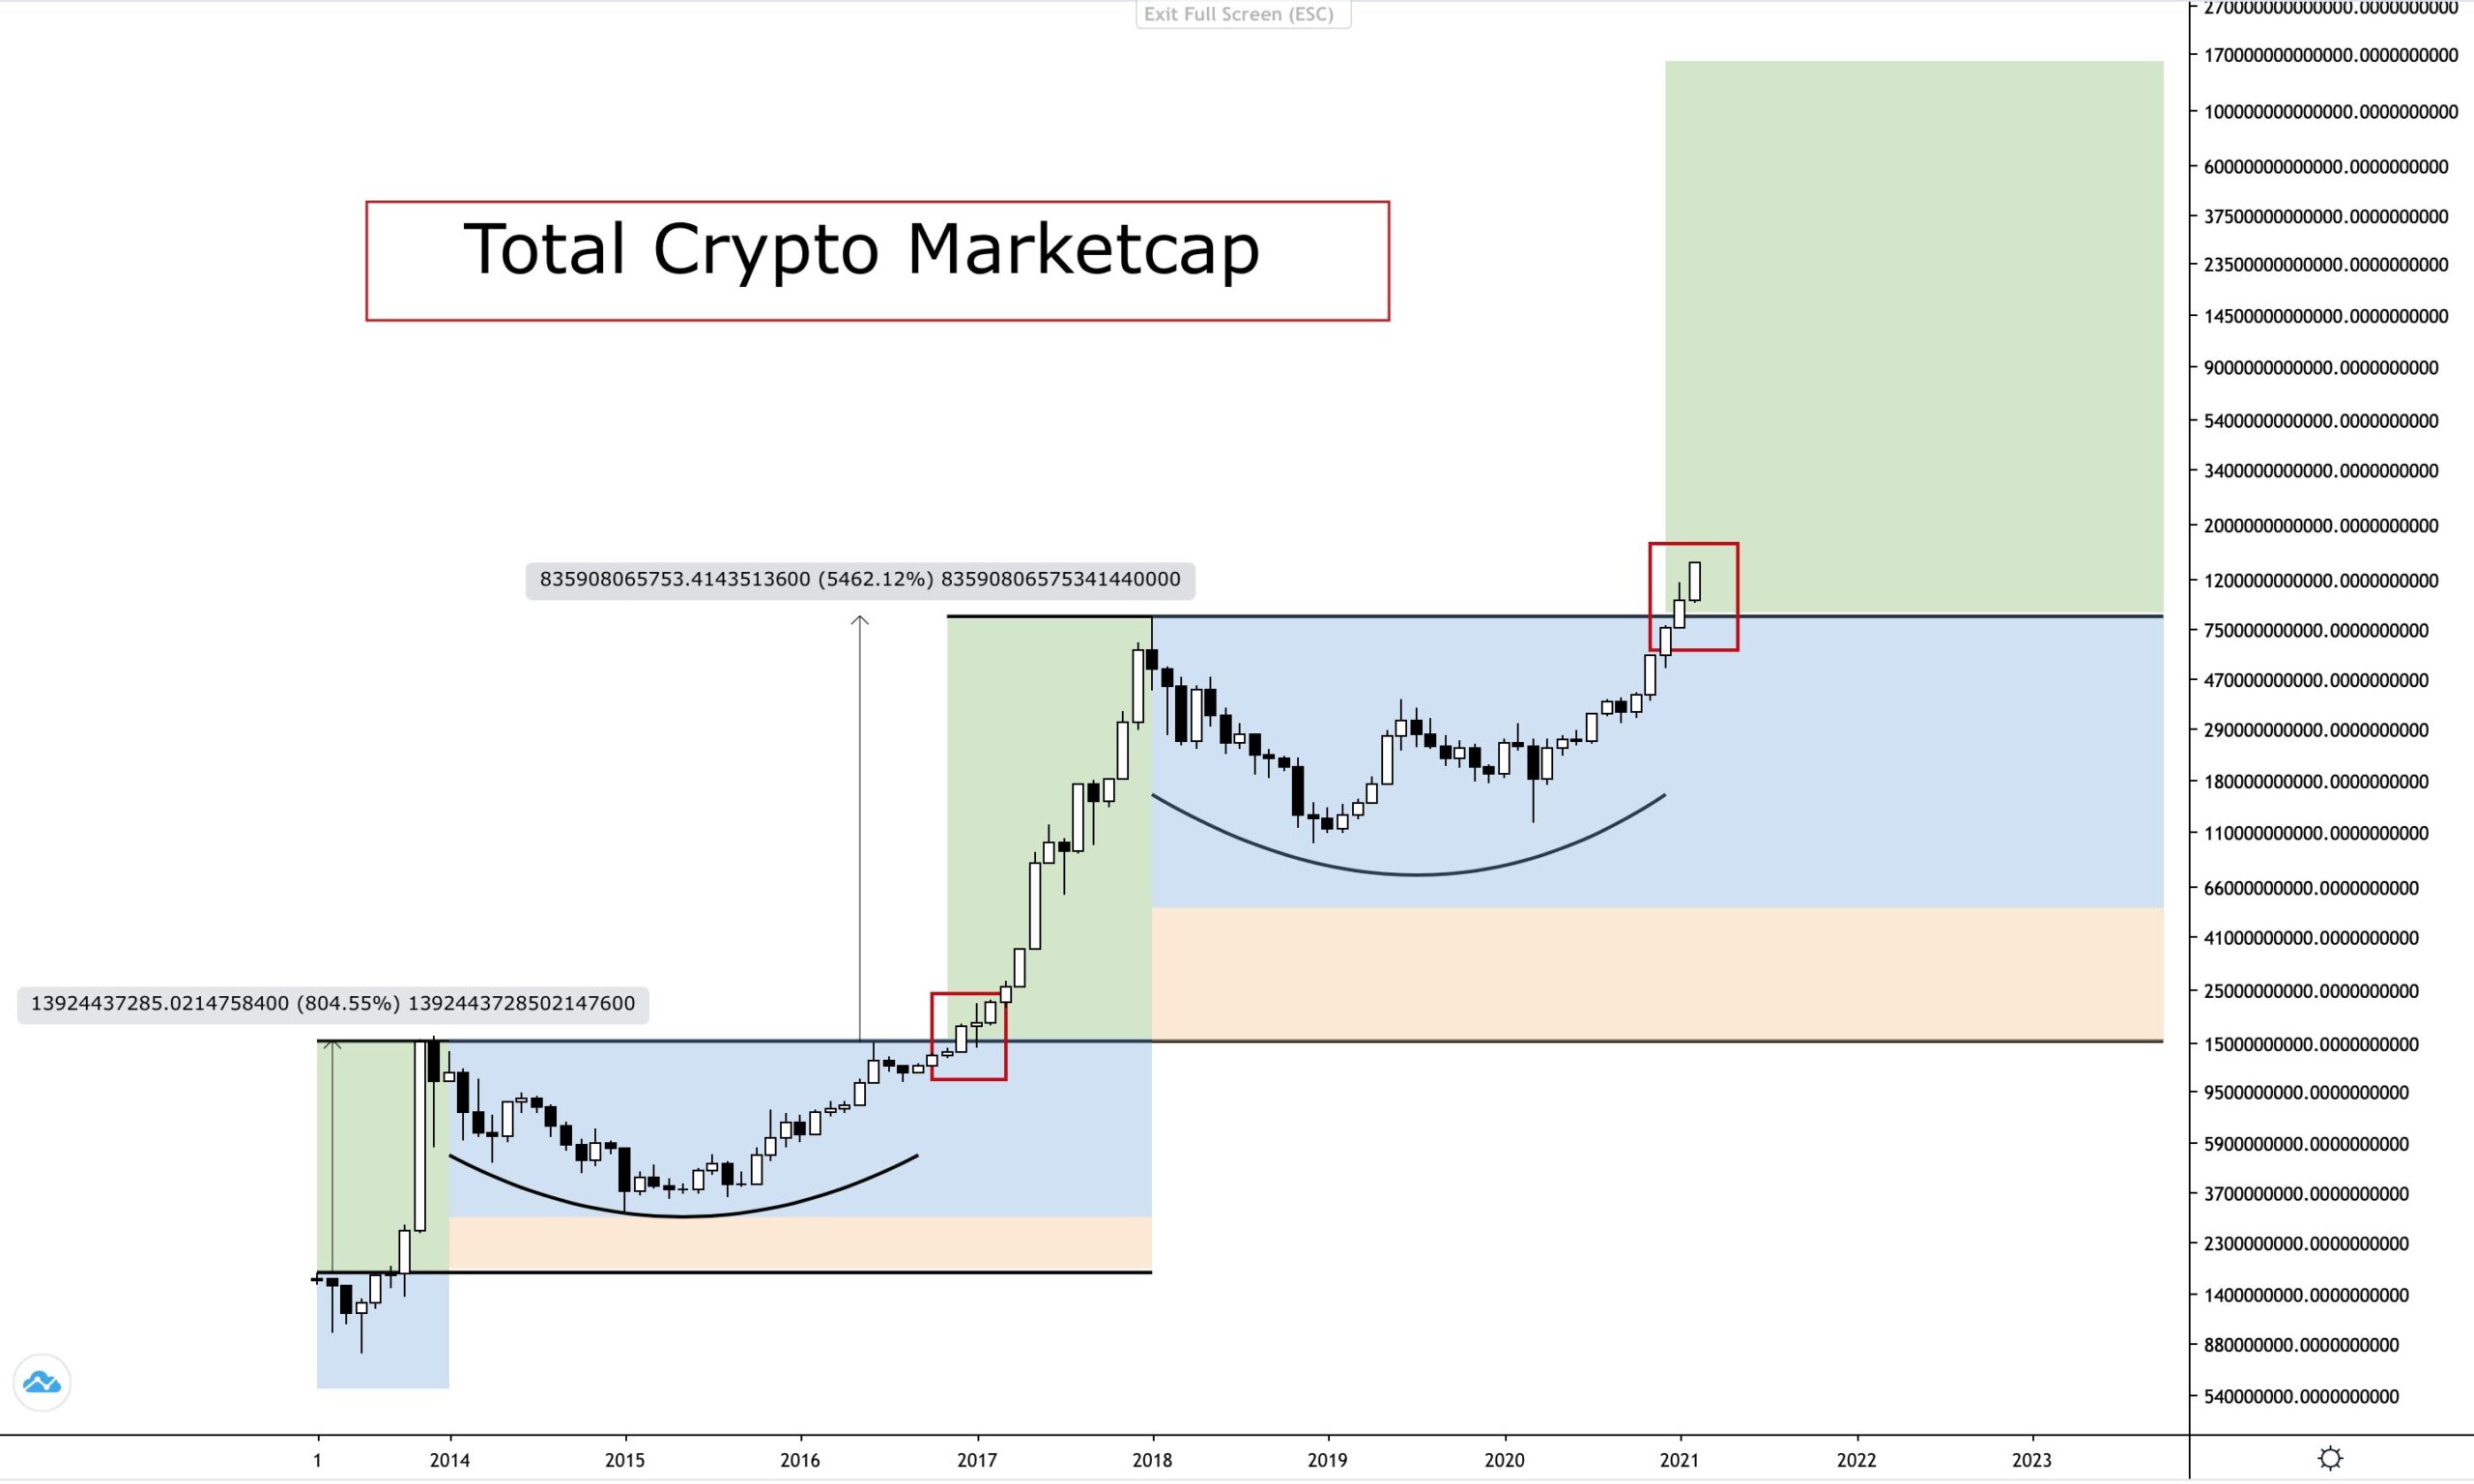
We can see the correlation with the previous bull run, which puts us at late 2016-early 2017. This was a time when older coins such as XRP, Ethereum, and Litecoin went on lung-busting runs following a lengthy accumulation process, resulting in similar emotions to what we are seeing now. Some will have inevitably sold on those pumps, thinking that alt season was over, when the data shows that it was only just beginning.
If In Doubt, Compare to Bitcoin
Of course we don’t know for sure that the next cycle will play out as in the image above, and when you see alts making all time highs and going on parabolic runs it’s tempting to think that the time to leave the markets is nigh. One example is Telcoin (TEL):
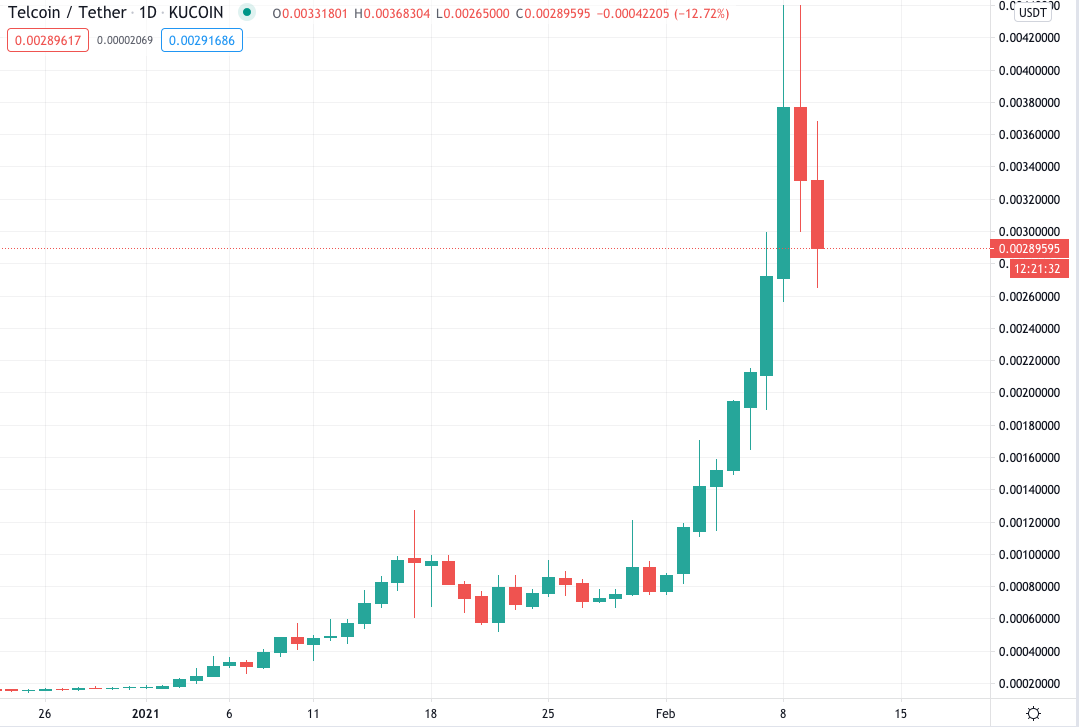
TEL has clearly been on a tear in 2021, ripping over 2,800% in six weeks. This might be enough for some holders to think that the pump is over. However, looking at this move on the Bitcoin chart we see a very different situation:
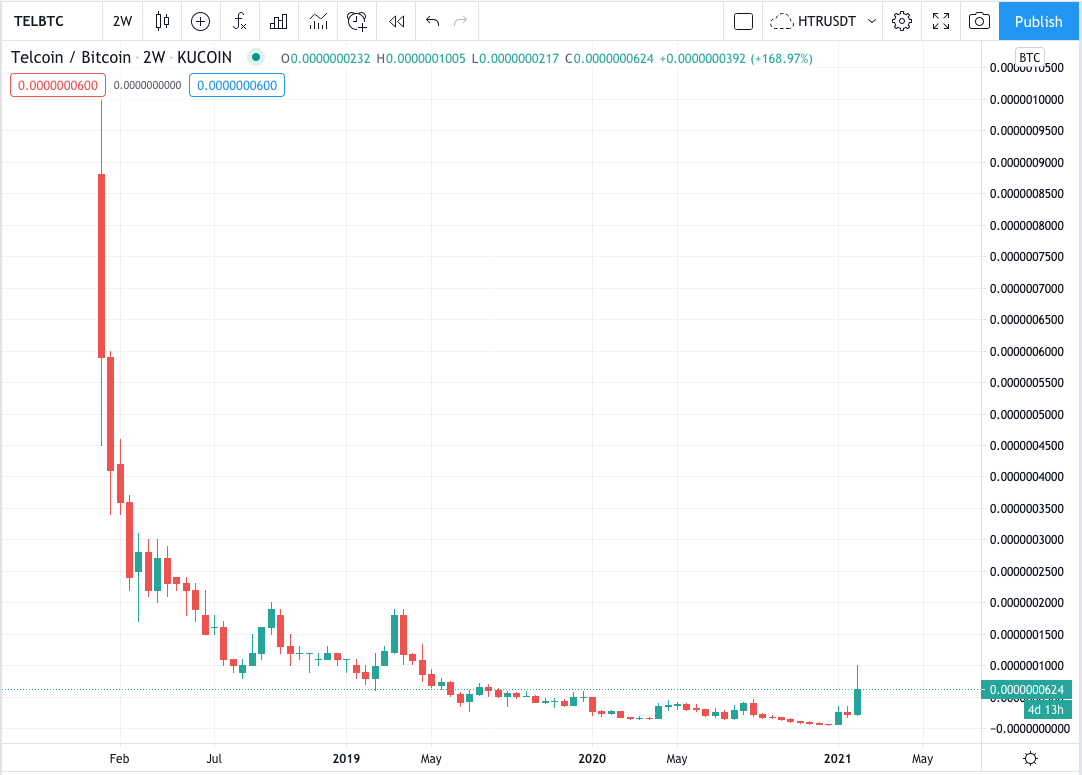
The near 3,000% move barely registers on the Bitcoin chart, showing just how much catching up TEL has to do. Now of course we can’t be sure that it will reclaim these former glories, but if we look back at the first image and see how much there is still to play in the cycle it’s far from out of the question. Alt season often allows altcoin prices the chance to play catch up with Bitcoin, which many achieve.
The same goes for all solid projects. All the evidence suggests that Bitcoin has some way to go before topping out, and those who were around for 2017 and before know exactly what comes next…